🚀 New: Reviews Overview Dashboard (Labs)
We’ve launched a brand new Reviews Overview Dashboard in Labs to provide you with deeper insights into your reputation performance—all in one place.
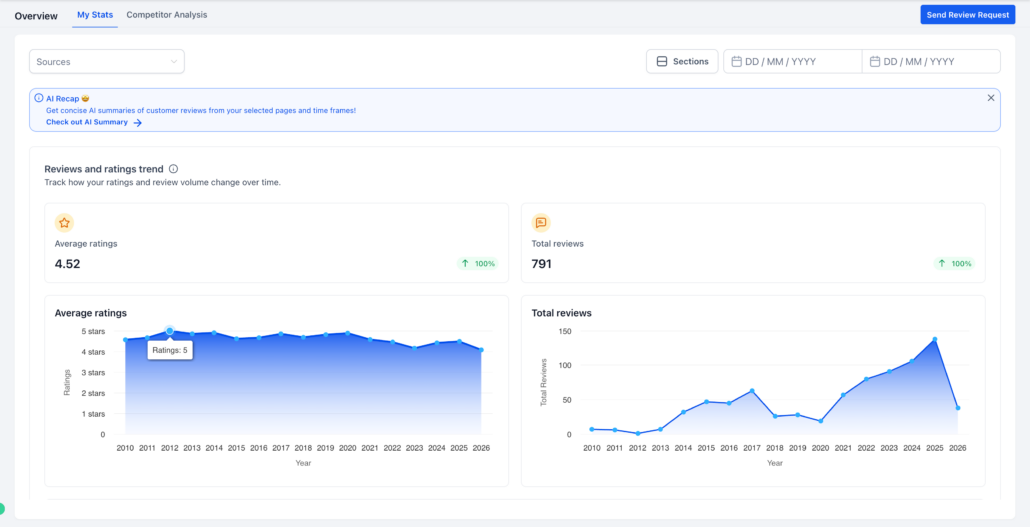
📊 Unified Performance View
Track your average ratings and total reviews over time.
Visualise trends with interactive charts (monthly/yearly views).

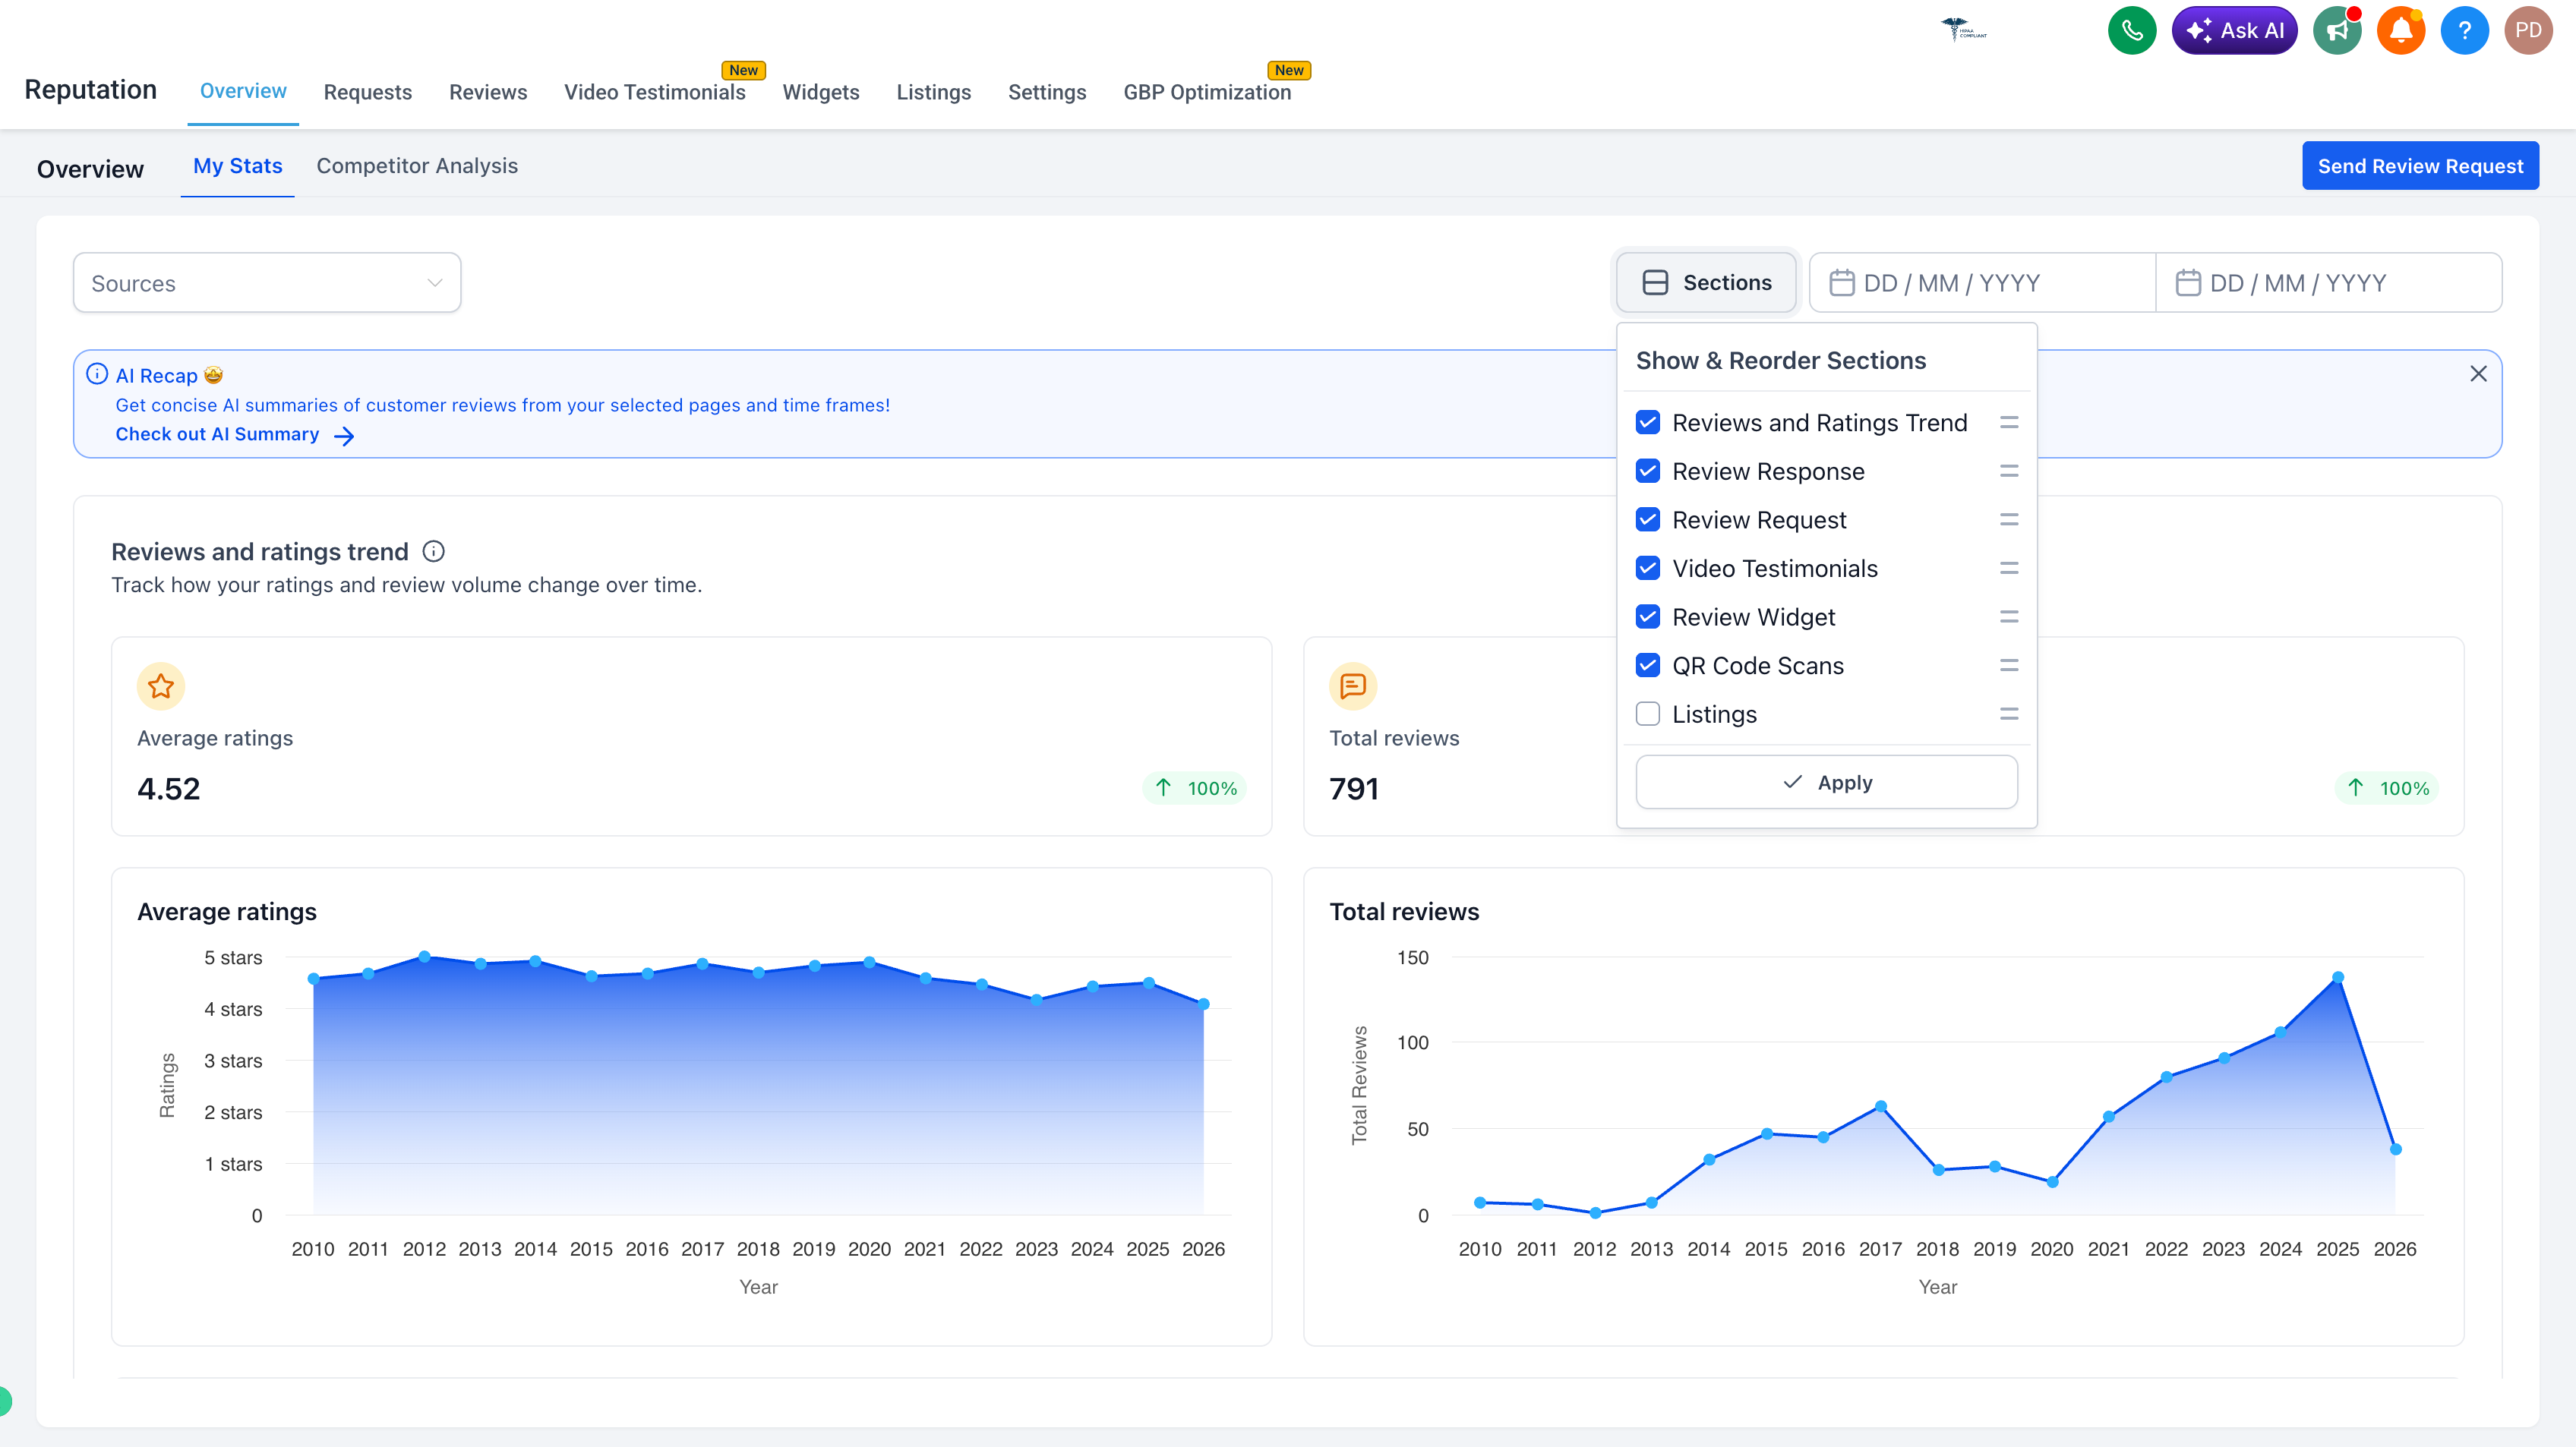
⚙️ Customisable Dashboard
- Show/hide sections using the new “Sections” control.
- Reorder modules to suit your workflow.
🔎 Source & Page Filtering
Filter data by specific pages and review sources.
Gain more granular insights into where your reviews are coming from.
Instantly generate concise AI summaries of customer feedback.
Filter by selected sources, pages, and date ranges.
Understand customer perception with positive, negative, and neutral breakdowns.
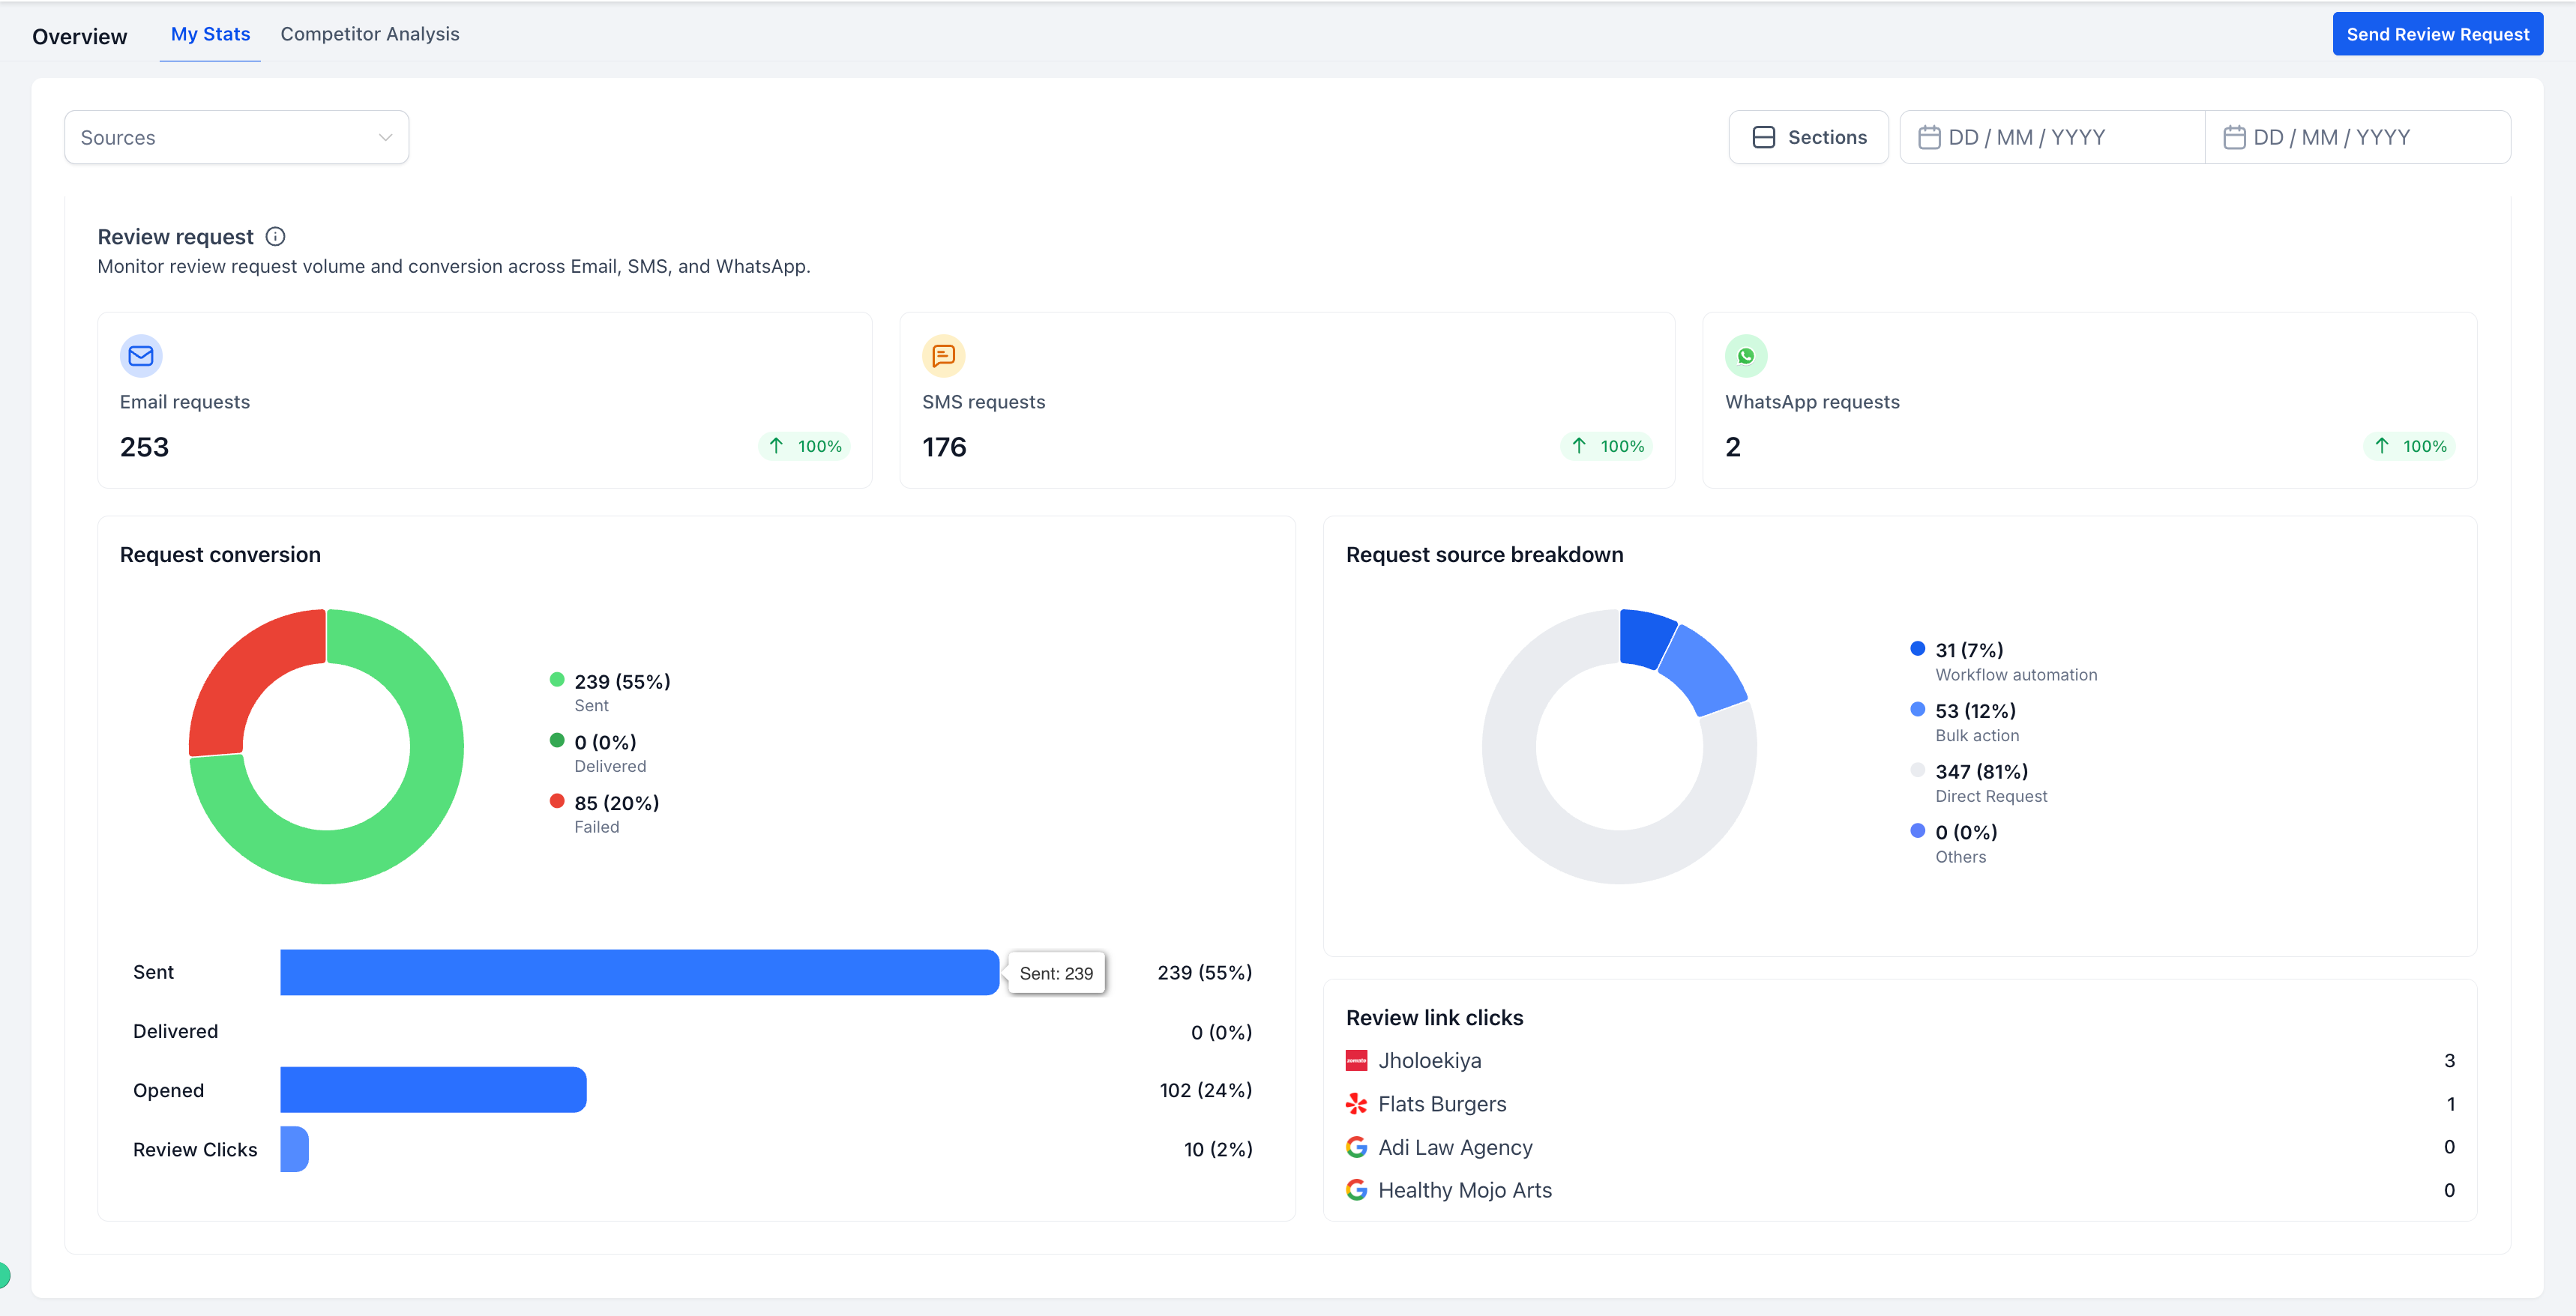
📩 Review Requests Analytics
- Monitor requests across Email, SMS, and WhatsApp.
- Track funnel metrics: sent → opened → clicks → conversions.
- View source breakdown (workflow, bulk, direct).
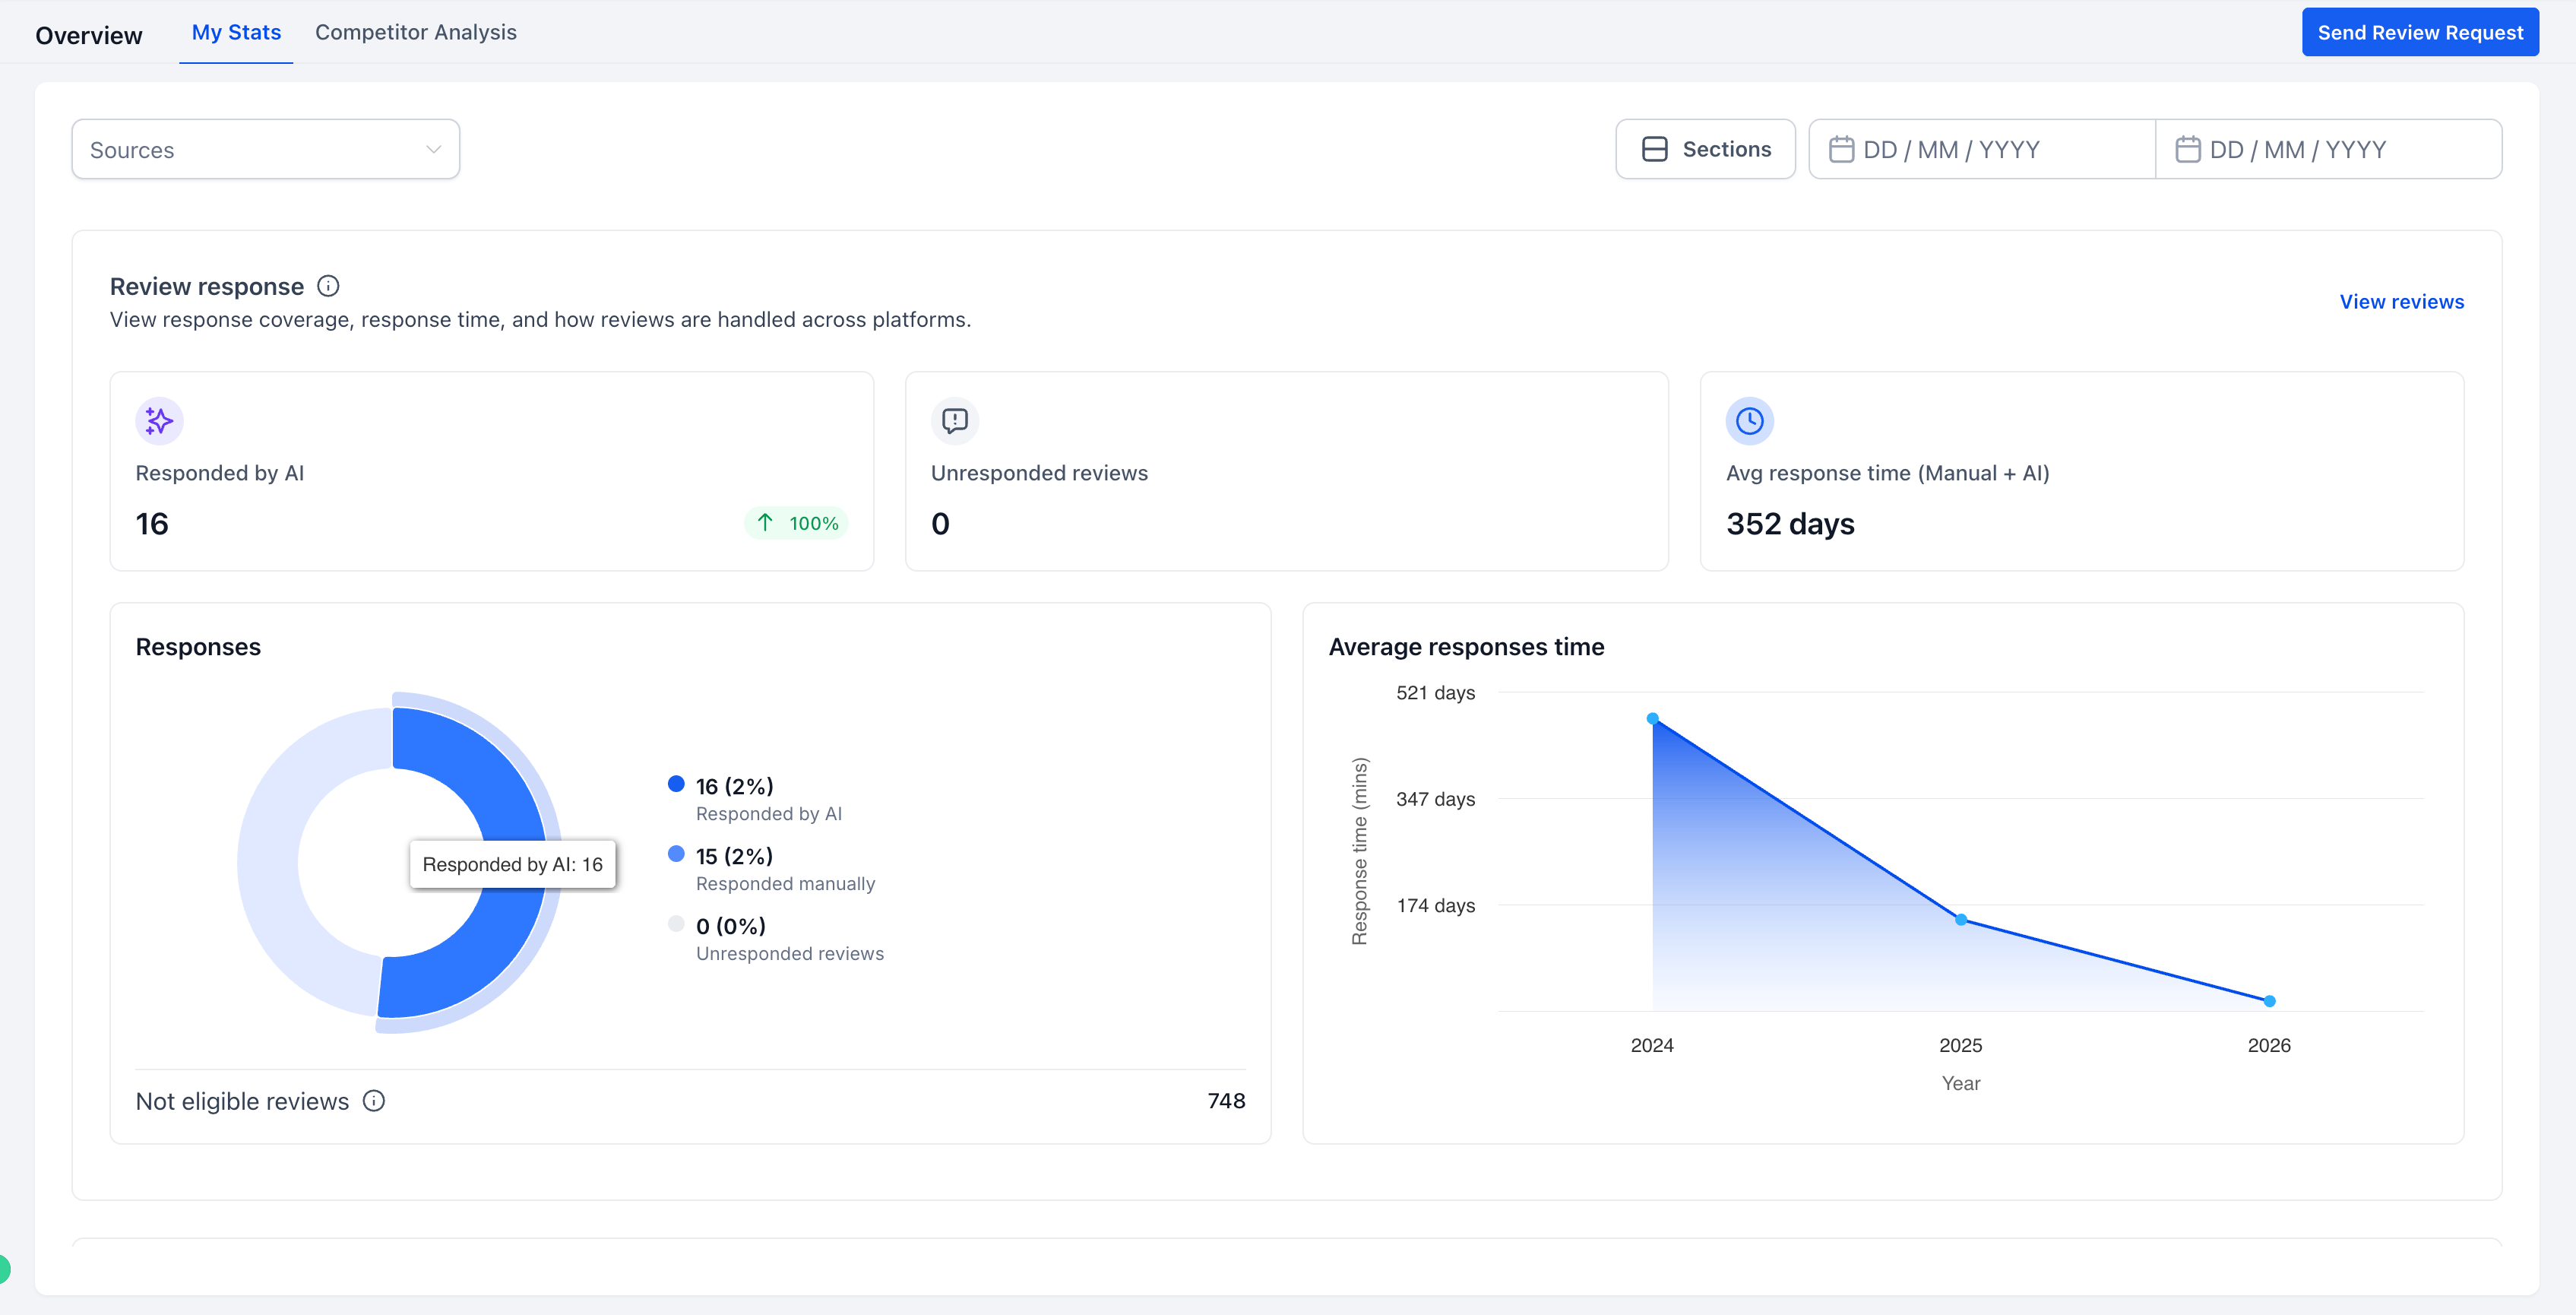
💬 Review Response Insights
- Measure response rate, AI versus manual responses, and unresponded reviews.
- Track trends in average response times.
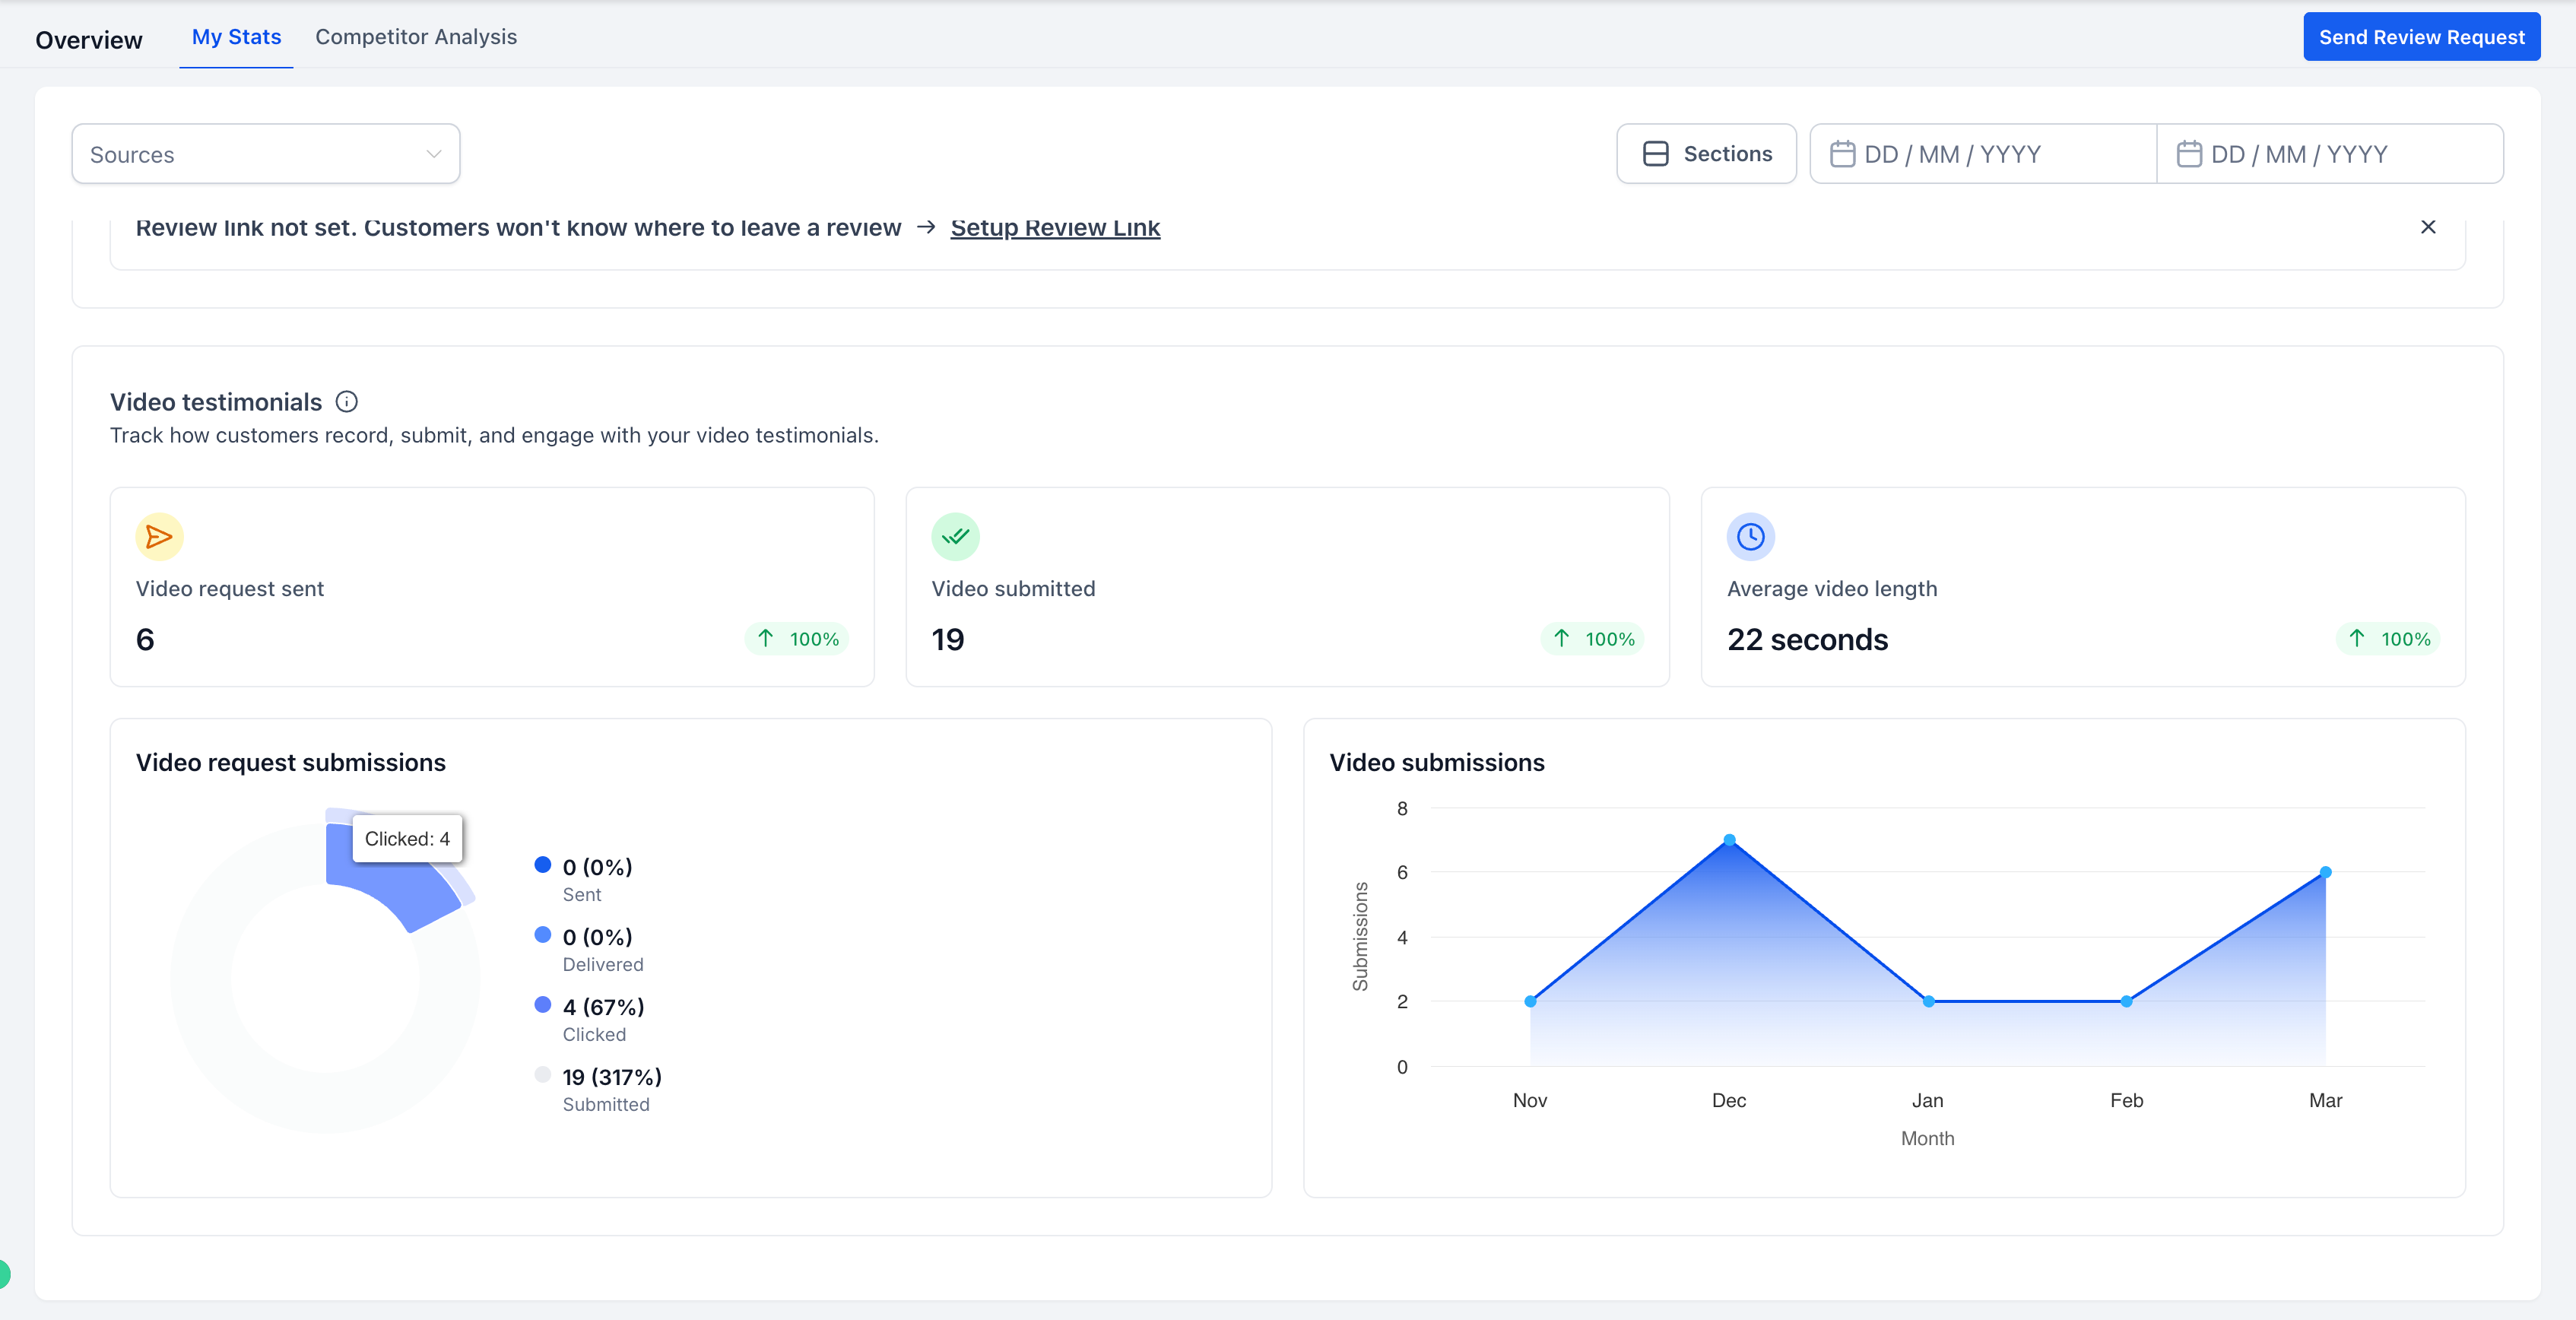
🎥 Video Testimonials Tracking
- Monitor sent requests, submissions, and engagement.
- View conversion performance and submission trends.
- Track average video length.
🧩 Review Widget Performance
- Analyse widget loads, impressions, and clicks.
- Understand on-site engagement with your reviews.
📅 Flexible Date Filtering
Apply custom date ranges across all widgets for deeper analysis.
This feature is currently available in Labs. We’d love your feedback to help shape future improvements!