Webhook Logs Dashboard in Developer Portal
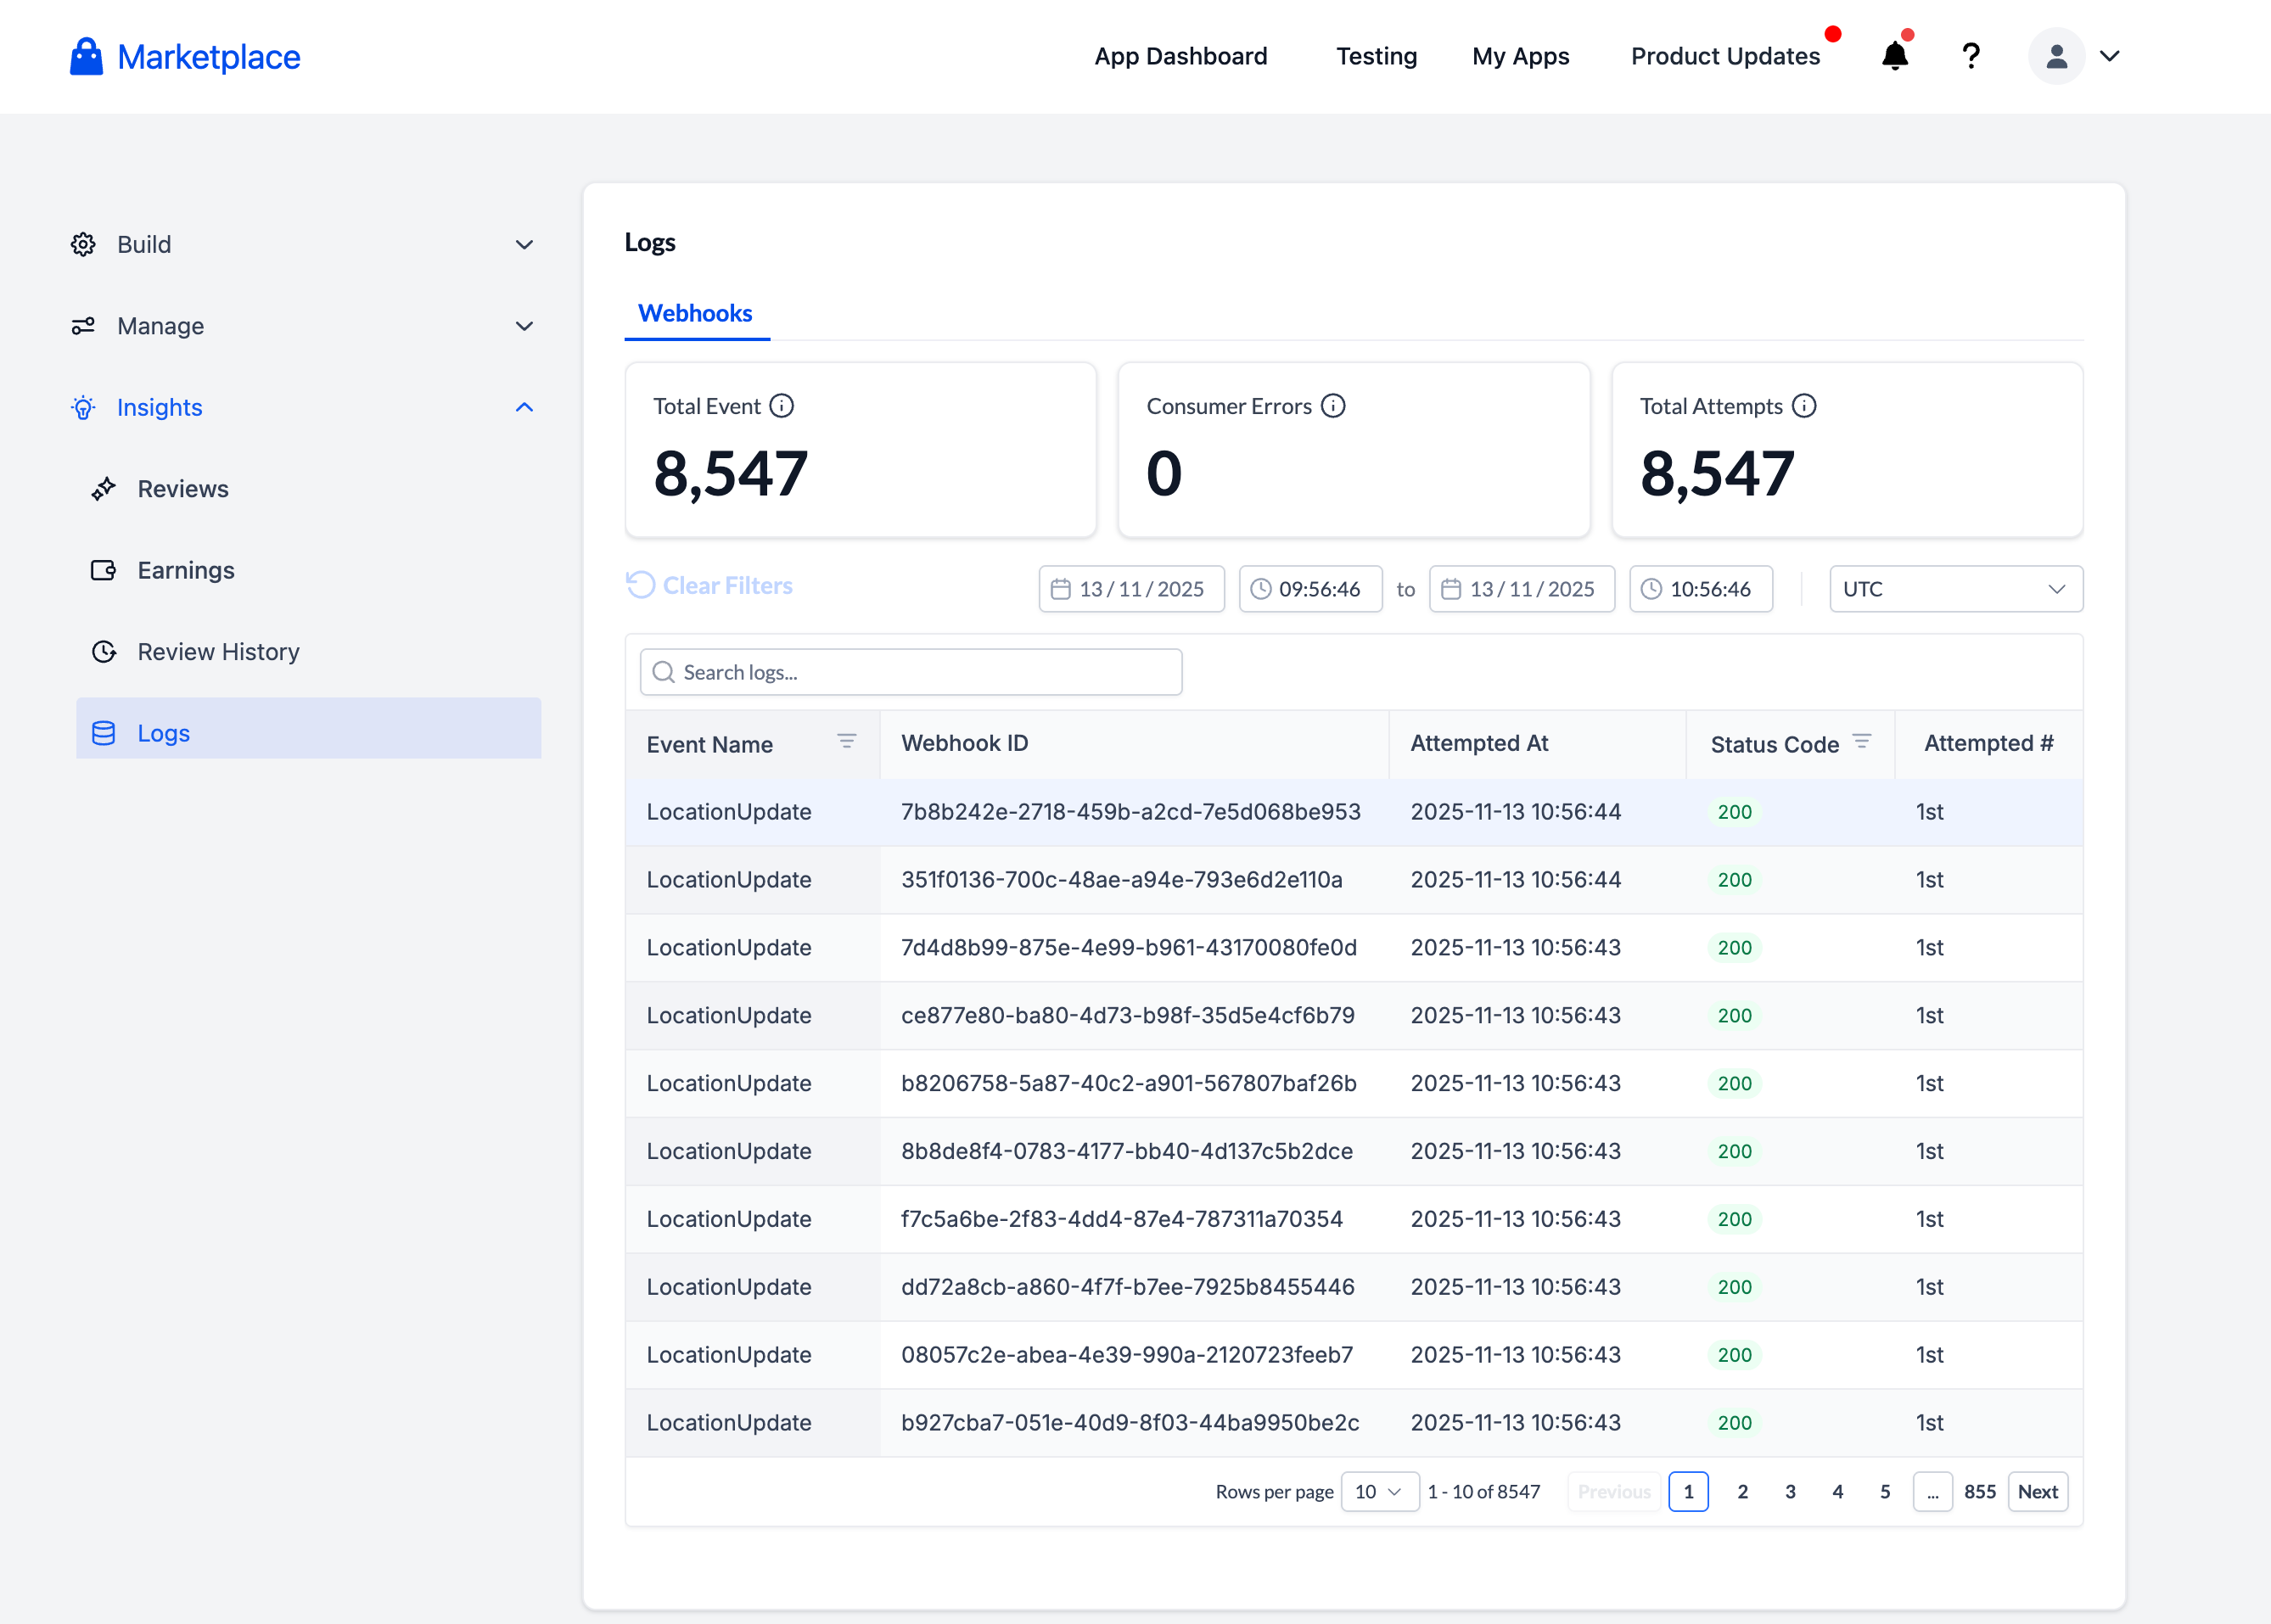
We’ve introduced a Webhook Logs dashboard in the Developer Portal (Insights → Logs) to enhance the debugging process for webhook issues—making it quick, transparent, and self-service.
Previously, developers and support teams had to submit support tickets to confirm whether Clixio had delivered a webhook. We often found that the issue was not on Clixio’s side.
This new dashboard provides developers with complete visibility into webhook deliveries, retries, and responses—no support ticket necessary.
- A new “Webhook Logs” tab under Developer Portal → Insights → Logs
- Optimised developer experience for debugging: Search by any substring in the payload
- 30-day retention period
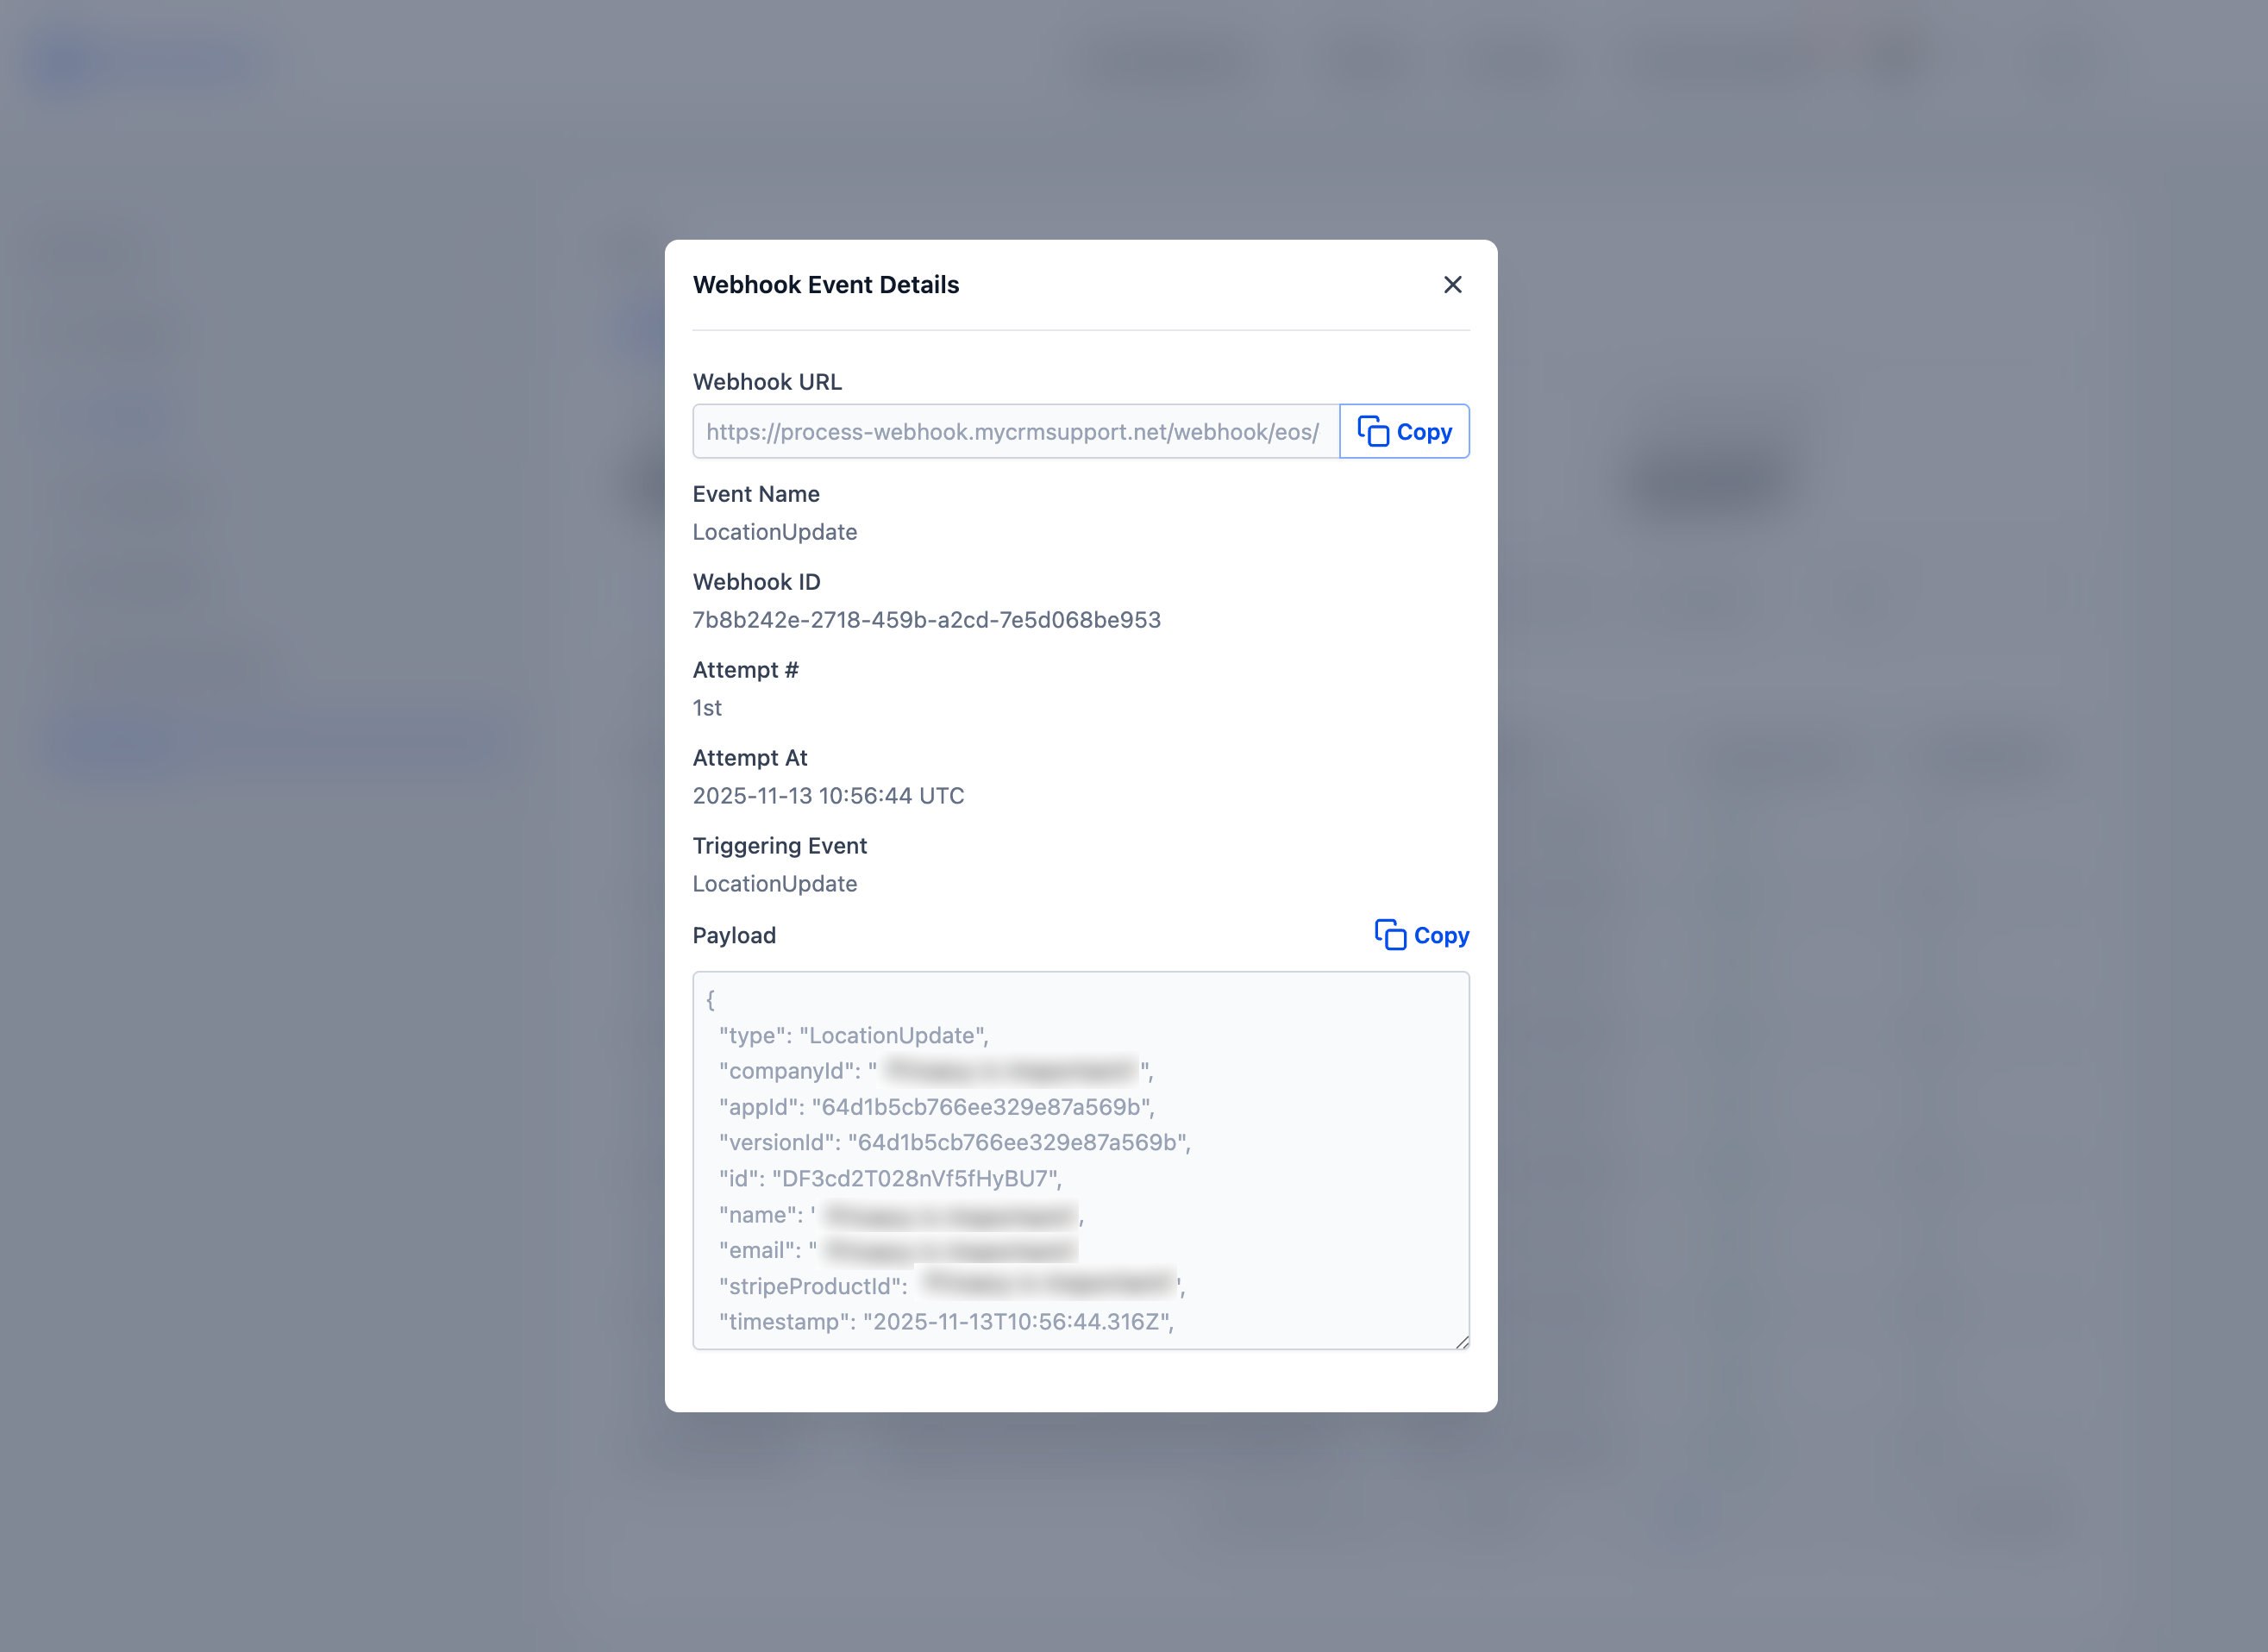
- Detail Panel: Click on any event row to view Webhook ID, Attempt #, Event Name, Timestamps, and Full Payload (including a “Copy” button)
- Timezone-aware views that default to Central Time, with overrides saved for future sessions
💻 **How to Use it as a Developer**
- Navigate to Developer Portal → Insights → Logs → Webhook Logs
- Filter or search by webhook ID, event type, or timestamp
- Click any row to open the detail panel and review payloads, response statuses, and retry history
- Easily copy payloads for debugging
- Set your timezone once—it’ll be remembered for future visits
💡 **Why This is Important**
This feature empowers developers with direct visibility into webhooks—reducing the number of support tickets, accelerating issue resolution, and enhancing trust in Clixio’s delivery infrastructure.