Introducing Geographic Analytics (State & City Drilldown)
Go beyond country-level data! Now you can delve into states and cities to see precisely where your traffic originates.
-
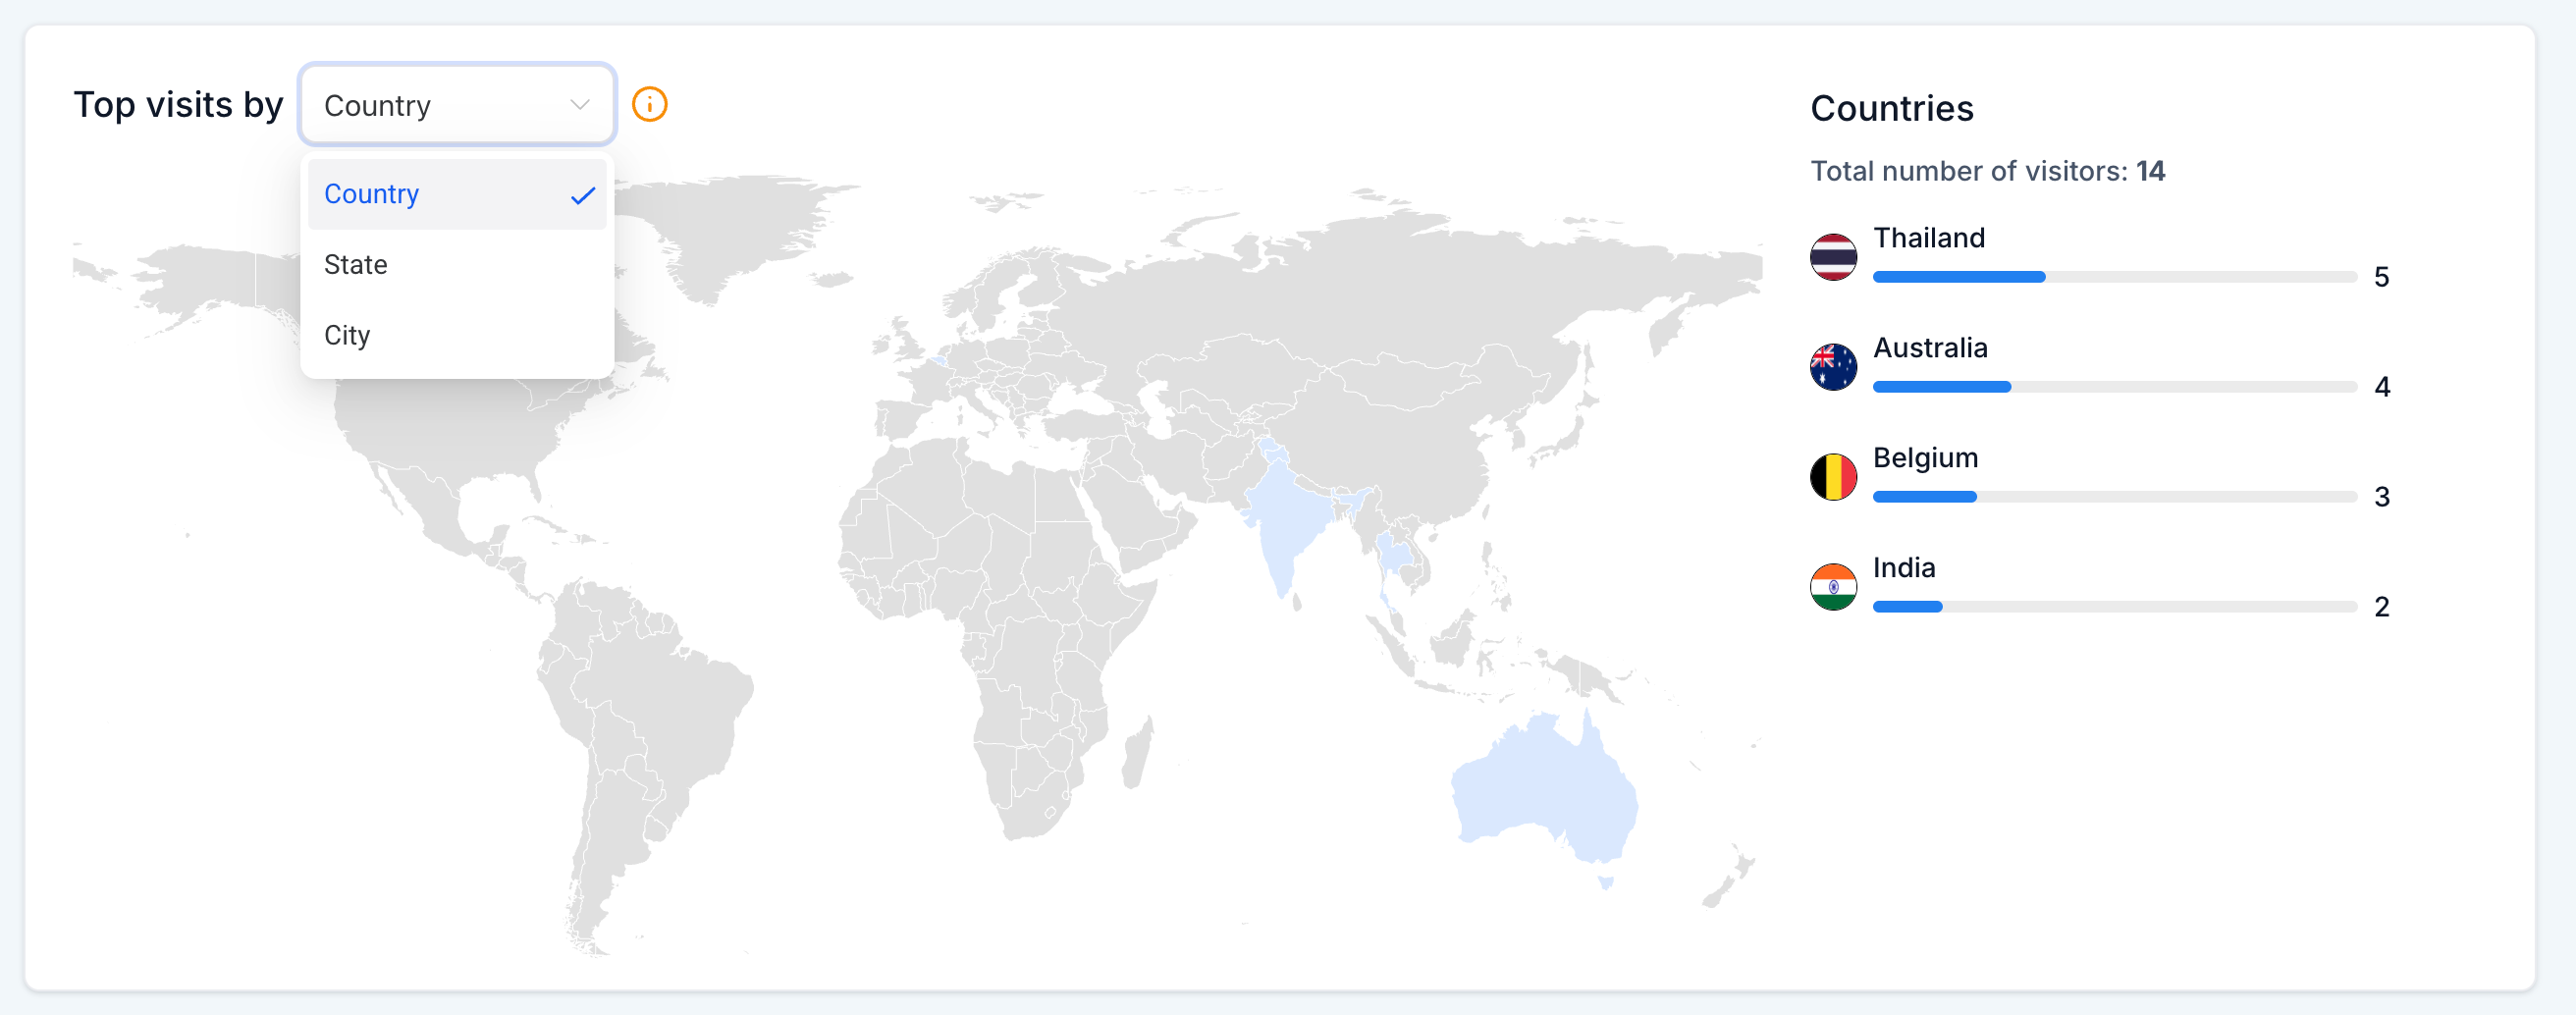
Geographic Dropdown: Switch seamlessly between Country, State, and City views using a single dropdown.
-
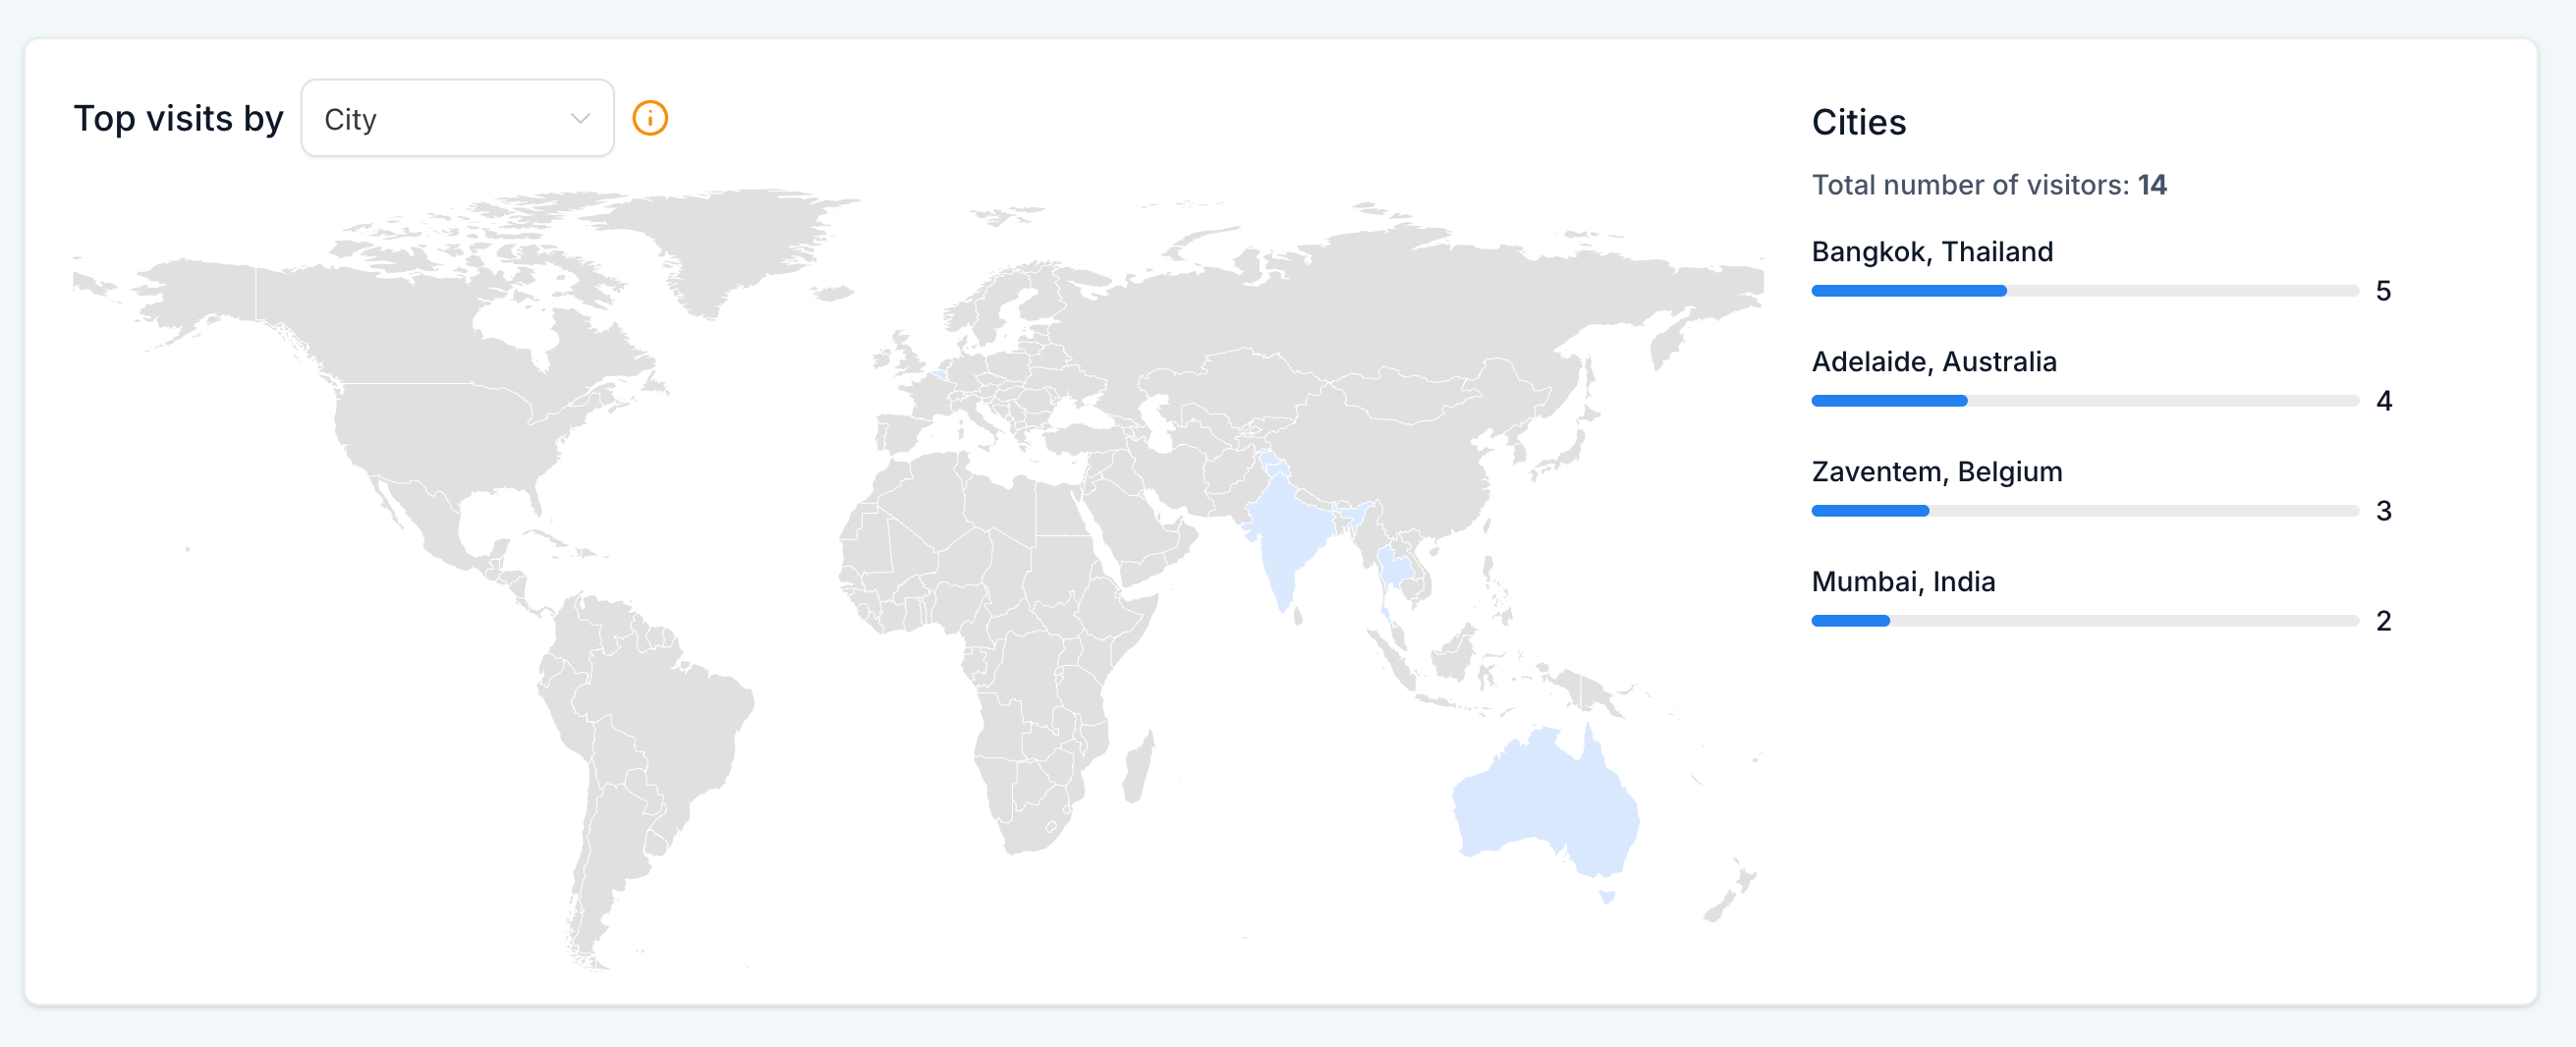
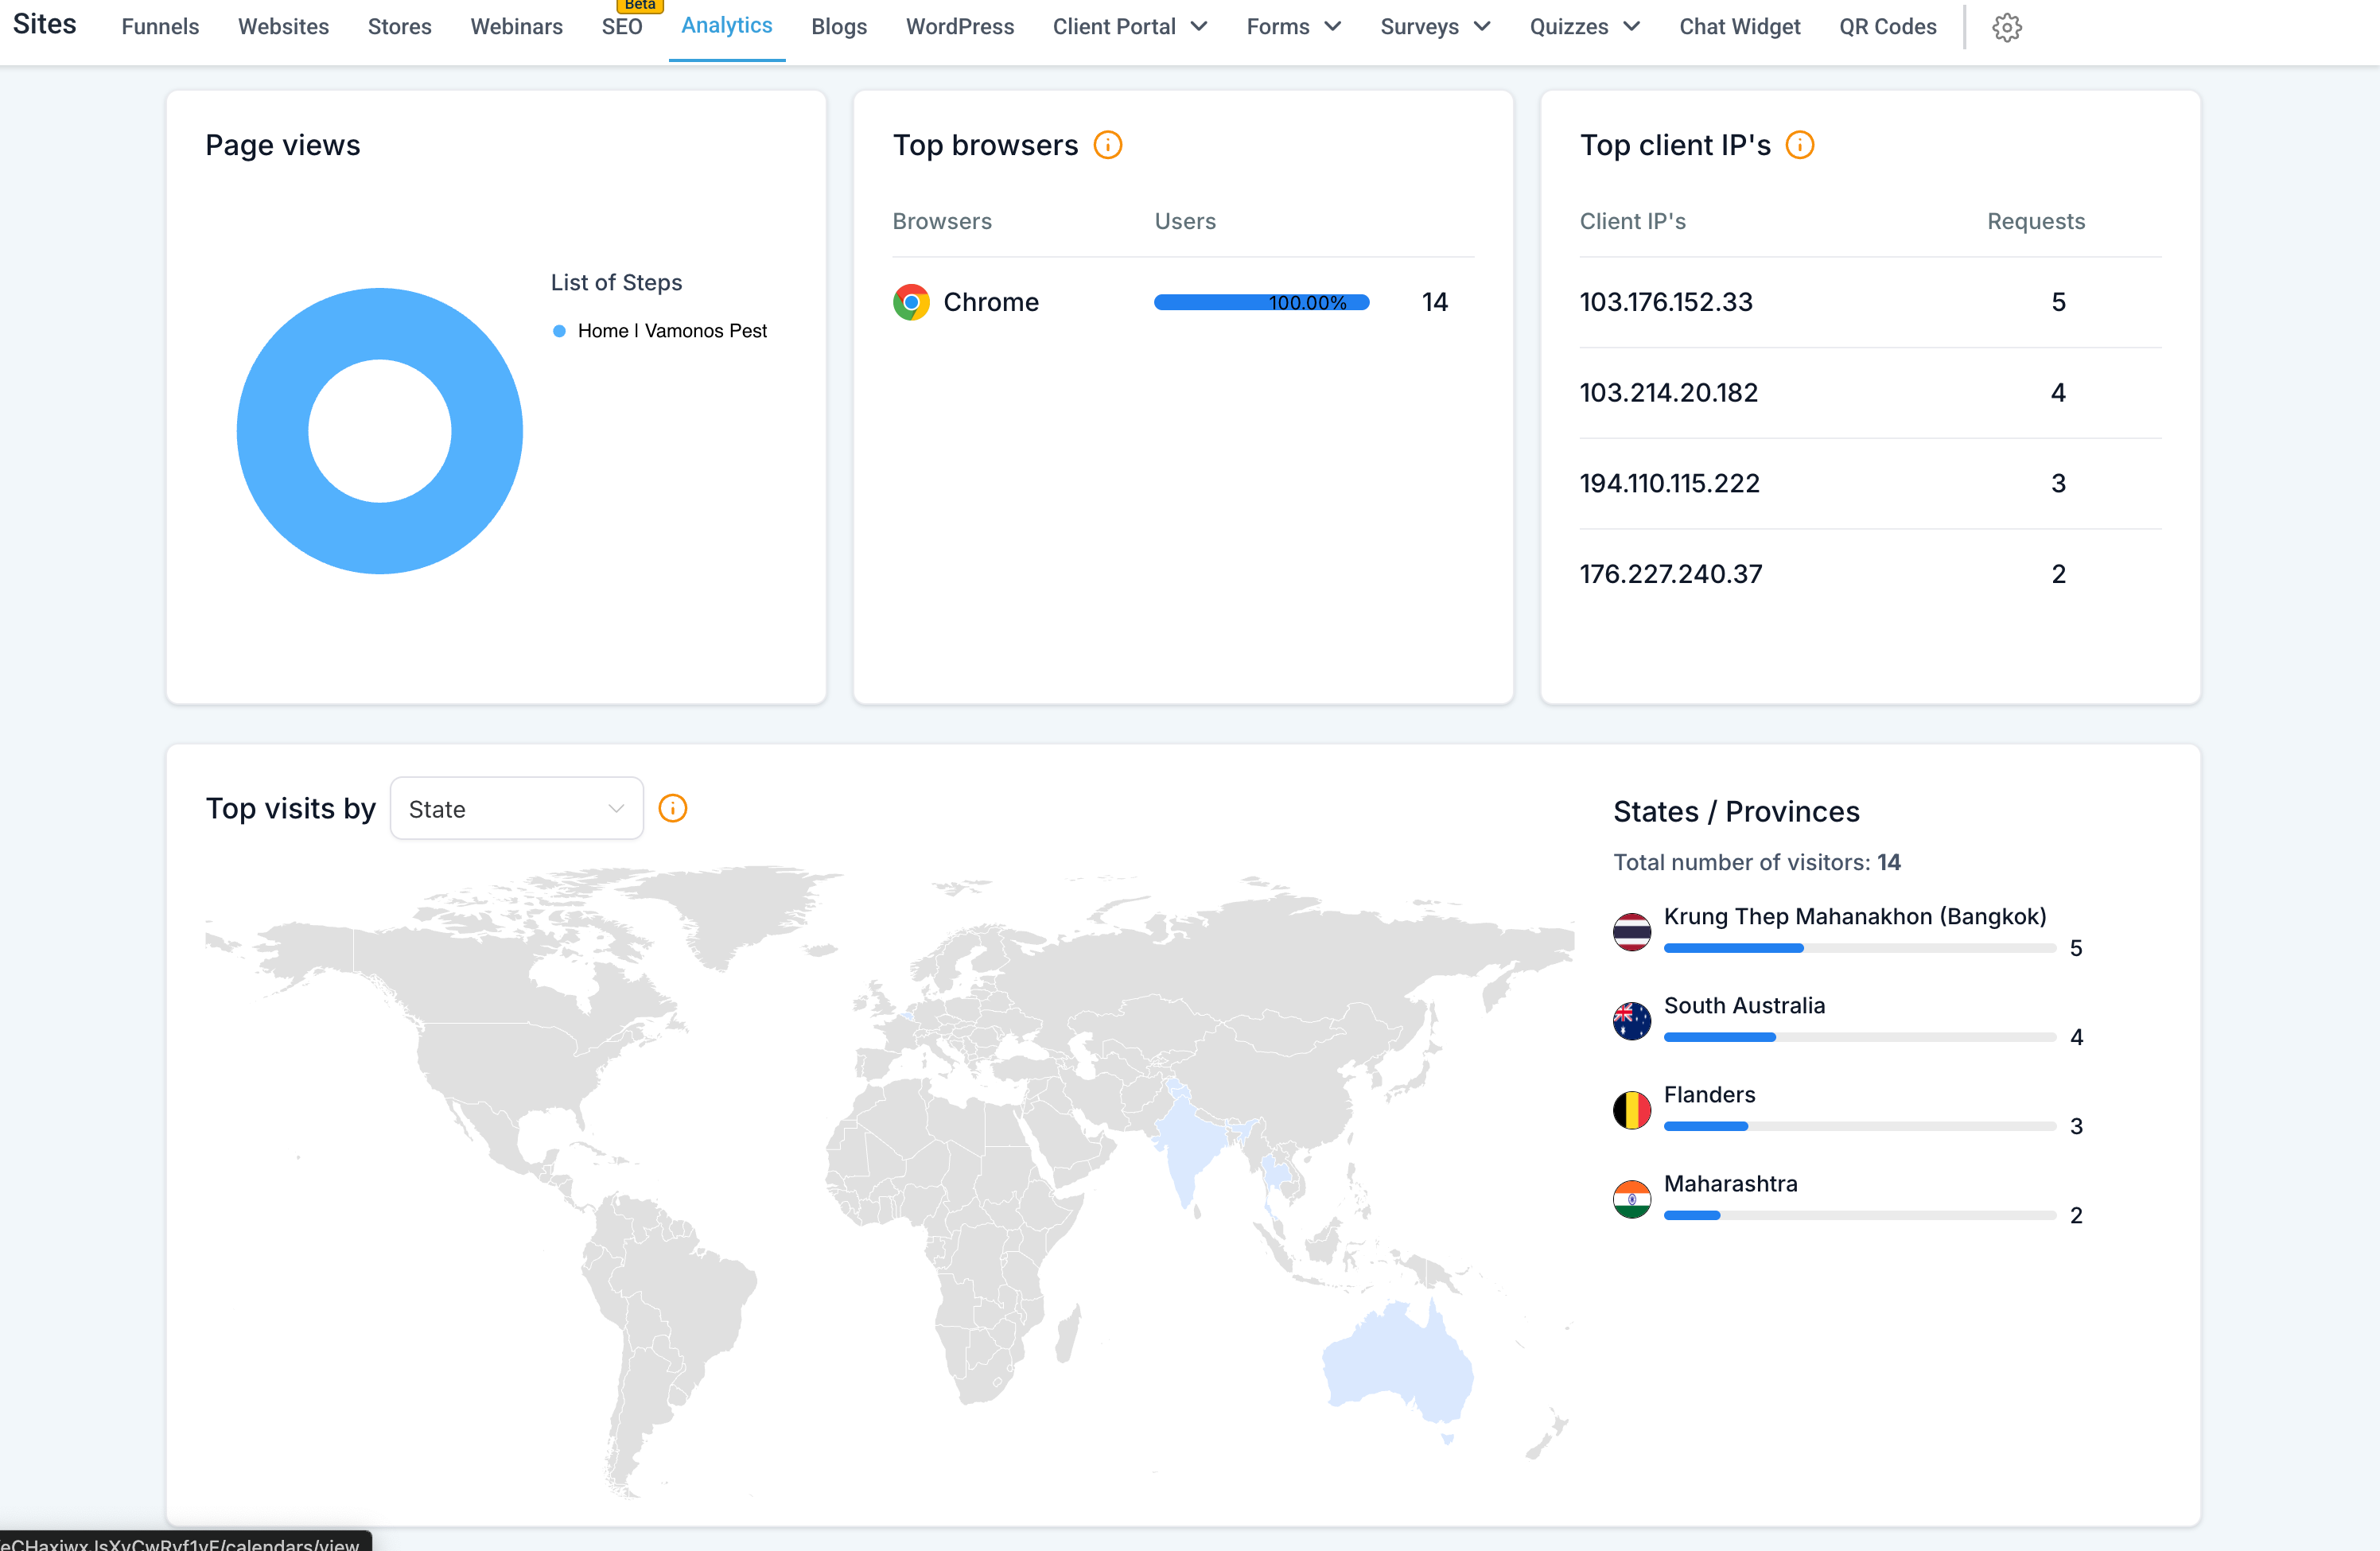
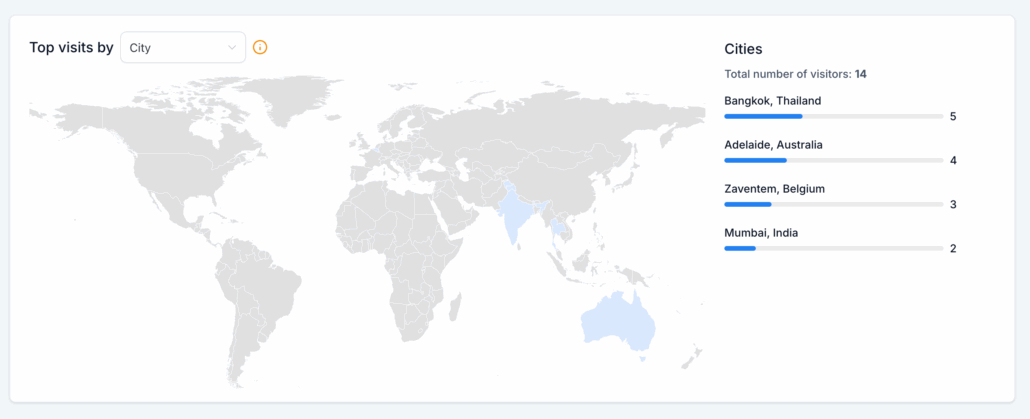
Ranked Lists: View your top regions with traffic counts displayed alongside the map.
-
Dynamic Heatmap: Interactive shading highlights high-traffic zones at any level.
-
Hover Tooltips: Hover over a state or city to instantly see visitor counts.
-
Total Visitor Count: Always visible and updates automatically when you change levels.
-
Dynamic Refresh: The map and list update in real-time as you switch between country, state, or city.
- Navigate to Analytics → Geographic Analytics.
- Use the dropdown above the map to toggle between Country, State, and City.
- Hover over regions to view detailed visitor counts.
- Refer to the ranked list for top-performing states or cities.
- Use insights to refine your local and regional campaigns.
📈 Why This Feature Matters
-
Local Businesses: Identify leading cities and concentrate efforts where demand is highest.
-
Business Managers: Compare states and regions to customise campaigns and effectively allocate resources.
-
Smarter Strategy: Pinpoint areas of high interest and focus on regional growth opportunities.