Traffic by Device Type in Sites Analytics!
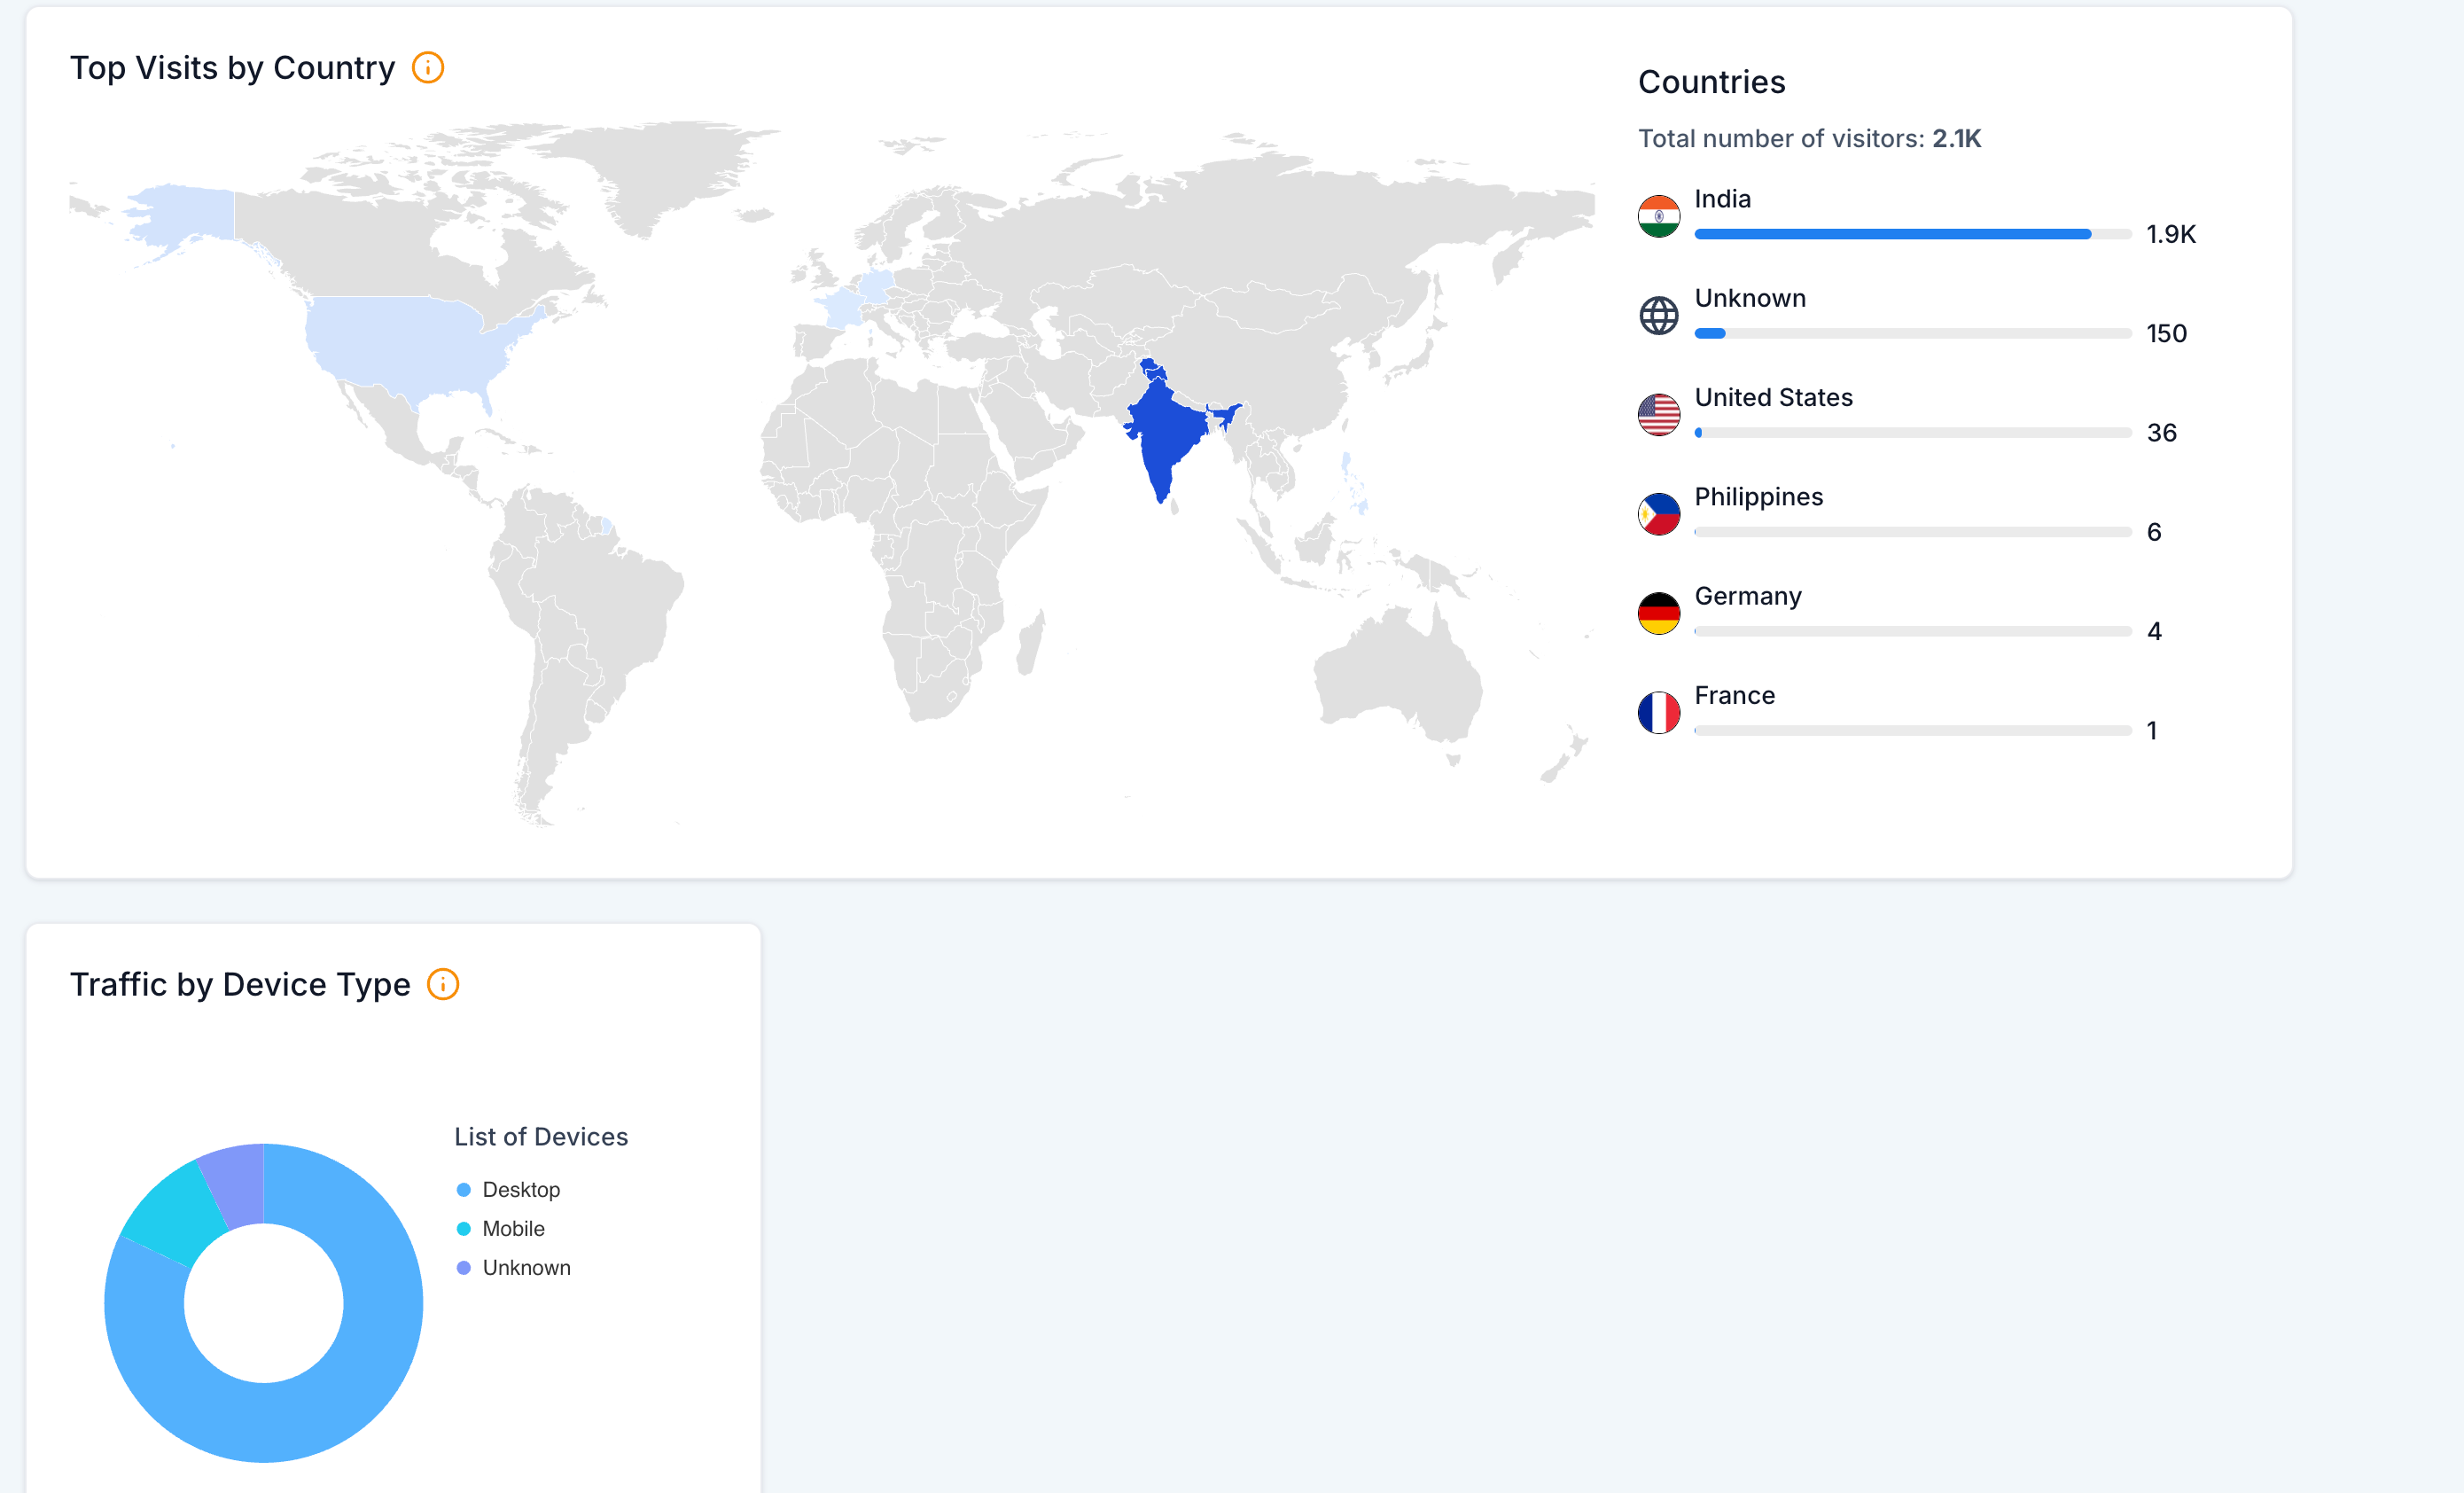
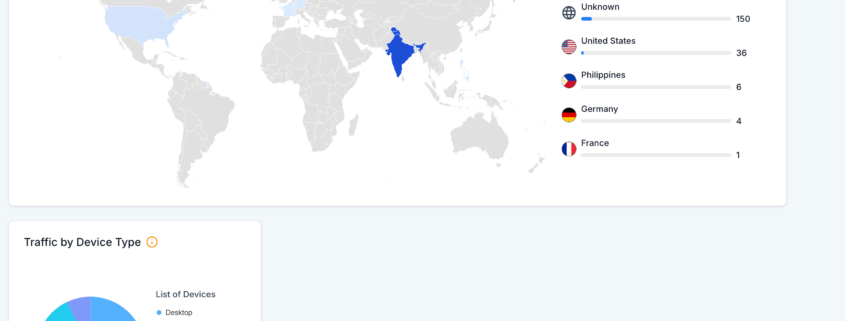
We’re introducing Traffic by Device Type, a new feature in the Sites Analytics dashboard that provides a clear breakdown of your visitors based on device category—mobile, desktop, or tablet.
This update adds an interactive pie chart in the Page Views section for both Funnels and Websites, helping you better understand and optimise for your audience’s preferred devices.
Interactive Device Breakdown
- Instantly see how much traffic comes from mobile, desktop, and tablet users.
- Hover and click for real-time insights on each device type.
- Spot trends at a glance to optimise your site across screen sizes.
Data-Driven Optimisation
- Understand user behaviour—Are most visitors on mobile? It’s time to optimise.
- Track changes over time to stay ahead of shifting device trends.
- Improve marketing and UX by tailoring content to match device preferences.
- Log into your account → Go to Sites → Click Analytics.
- Use the dropdown to select Funnels, Websites, or both.
- Choose a date range (7 days, 30 days, or custom).
- Scroll to “Traffic by Device Type” and explore the interactive pie chart.
Why You’ll Love It
- Clear and visual—no complex reports, just an easy-to-read pie chart.
- Better targeting—adjust content, ads, and UI based on actual device data.
- Detect anomalies—spot unusual spikes in device usage and investigate.
This feature makes it easier than ever to make informed, data-driven decisions. Try it out now and optimise your site for every visitor.


